Feed planning in Uganda usually starts at the agrovet shop. Somebody works out that the animals need more, goes to the trading centre, and buys a sack of something.
That is the wrong end of the problem. On most Ugandan farms there is feed sitting in the fields, along the roadside, behind the mill and in the neighbour's garden that is never counted because it never had a price attached to it. Until you know what is genuinely available, and in which months, you cannot tell whether you have a shortage of feed or a shortage of organisation.
This guide is a structured way to find out.
What this guide helps you decide
This guide helps you answer one question: what feed can I actually get hold of, and in which months of the year?
It gives you a recording method adapted from the way formal feed assessments are done, a walk-through procedure for your own farm and neighbourhood, and a set of cautions about what you can and cannot count on.
It applies to cattle, goats, sheep and poultry. It does not tell you how to process any particular feed material, how to make silage or hay, or how to build a fodder calendar from the inventory. Those come after this step.
Borrowing the method that researchers use
The International Livestock Research Institute developed a tool called FEAST, the Feed Assessment Tool, which it describes as a systematic method to assess local feed resource availability and use. It combines a participatory group exercise with a quantitative questionnaire, and produces a report covering overall feed availability, quality and seasonality [1].
You do not need the full tool. What is worth borrowing is how it organises the question.
The FEAST individual farmer questionnaire divides feed into six categories [2]:
- Crop residues, such as maize stover and rice straw
- Legume crop residues, recorded separately because their quality is different
- Green forage, including roadside weeds, cut fodder and tree leaves
- Grazing
- Concentrates, including bran, grains and oilseed cakes
- Other sources, specified by the farmer
The grid later in this guide adapts those categories for a Ugandan farm, splitting out processing by-products, which are a large and often overlooked source here.
For quantity, the questionnaire relies on farmer-reported weights in local units, falling back on extension or secondary estimates where a farmer cannot quantify something [2]. In other words, an approximate number written down beats a precise number you never collect.
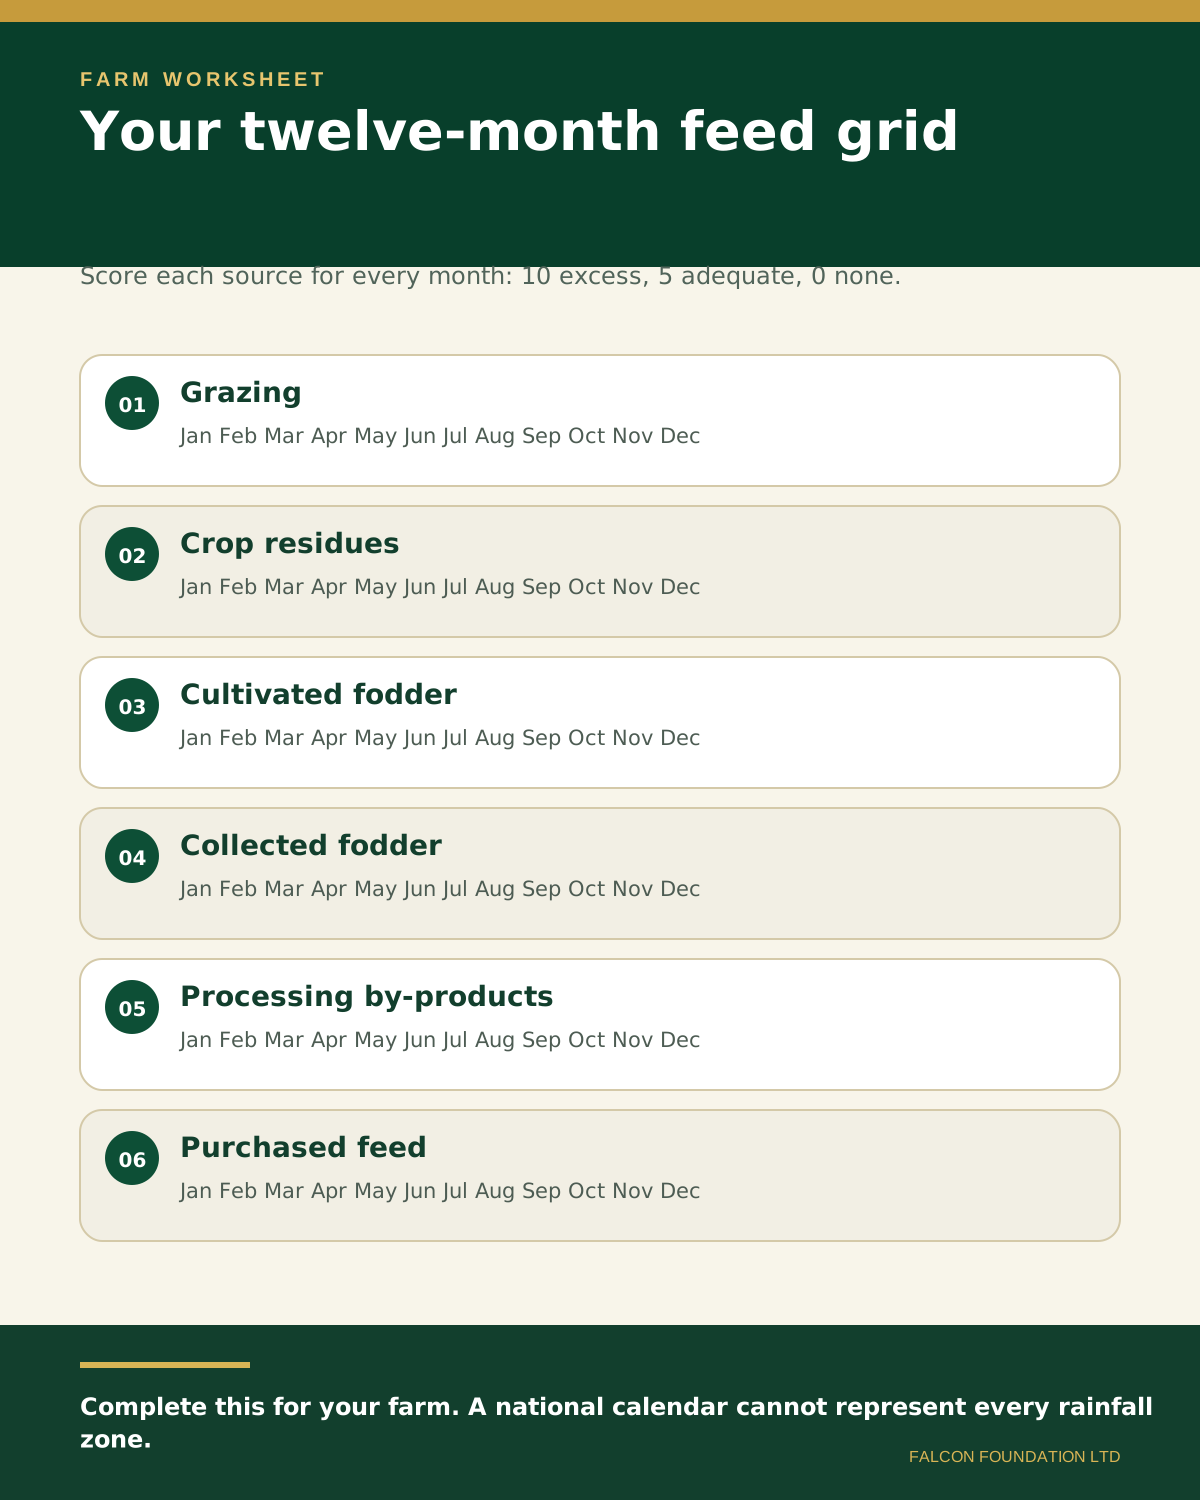
For seasonality, it records a monthly feed availability score from 0 to 10, where 10 is excess feed available, 5 is adequate feed available and 0 is no feed available. It then records the proportion each feed source contributes in each month, with all sources for a given month adding up to 10 [2].
That monthly scoring is the single most useful part of the method for a Ugandan farmer, and it is what the grid below is built on.
Why a national feed calendar will not fit your farm
Uganda does not have one rainfall pattern. It has two, and they produce completely different feed years.
FEWS NET's seasonal calendar for Uganda distinguishes unimodal rainfall areas, which have one rainy season, from bimodal areas, which have two. In bimodal areas the season windows fall approximately from March to May and from September to November [3]. FEWS NET's country reporting states directly that Karamoja is unimodal while the cattle corridor is bimodal [4].
Within Karamoja alone there is further variation. FEWS NET's livelihood zone work describes some zones with a long rainy season from April to October with a mild dry spell in June, another running from late March through to September, and one bimodal zone from late March to November with a mild dry spell in June and July. Rainfall ranges from 700 to 1,000 millimetres in the wet western belt down to 500 to 800 millimetres towards the dry extreme east [5].
So a feed calendar published for Uganda as a whole is useless to you. The grid you fill in for your own farm is not.
What Ugandan farms actually feed
Two Ugandan studies give a realistic picture, and they differ by region, which is the point.
In Buyende district, a semi-arid area, a study of smallholder goat feeding found natural pasture supplying about 70 per cent of the diet, crop residues about 15 per cent and food by-products about 12 per cent. The residues named were sweet potato vines, maize, millet and sorghum stover, and rice straw. The by-products were sweet potato, banana and cassava peels. The study identified 48 browse and herb species across 18 plant families, and recorded that herbaceous species availability is restricted to the wet season, so once grasses and herbs dry up, browse, crop residues and by-products are the only options left. Ninety per cent of farmers used tethering [6].
In Nakaseke district, a characterisation of a dairy farmers' association recorded cattle, goats and poultry, with grazing dominant in the wet seasons of March to May and September to November, and grazing dropping drastically in the January to February dry season with only limited crop residues available. Overgrazing and dry-season water scarcity were the constraints named [7].
For poultry, the picture is different again. A study of indigenous chicken flocks in eastern Uganda found scavenging was the major feeding system, supplemented seasonally with cereal grain, and that supplementation was practised only during the harvesting season, with 73 per cent of farmers feeding by pouring grain on the ground [8]. A 2025 study covering 320 poultry farmers and 59 feed millers across ten districts found 59.7 per cent using commercial feed, with white maize, maize bran, fishmeal and soybean meal as the main ingredients, and reported that maize and maize bran were most available in August and least available in October and November, with 43 per cent of respondents reporting that seasonal availability affected prices [9].
Purchased feed is far from universal. An East African dairy baseline survey found only 4.3 per cent of Ugandan cattle-keeping households surveyed reported purchasing feed or fodder [10].
The walk: how to do the stocktake
Set aside half a day. Take a notebook, a pen and somebody who knows the area. Walk the farm first, then the immediate neighbourhood, then the nearest trading centre.
At each stop, record six things about every feed resource you find.
| What to record | Note |
|---|---|
| What it is | Name it plainly |
| Months available | Use the twelve-month grid |
| Roughly how much | Local units are fine |
| How far away | Walking distance or transport |
| Whose it is | Yours, a neighbour's, communal |
| What else it is used for | Fuel, mulch, sale, food |
On the farm
Look for crop residues first. Maize and sorghum stover, bean haulms, sweet potato vines, banana leaves and pseudostem, groundnut haulms. Then any planted fodder. Then the grazing area, and be honest about how long it lasts.
In the neighbourhood
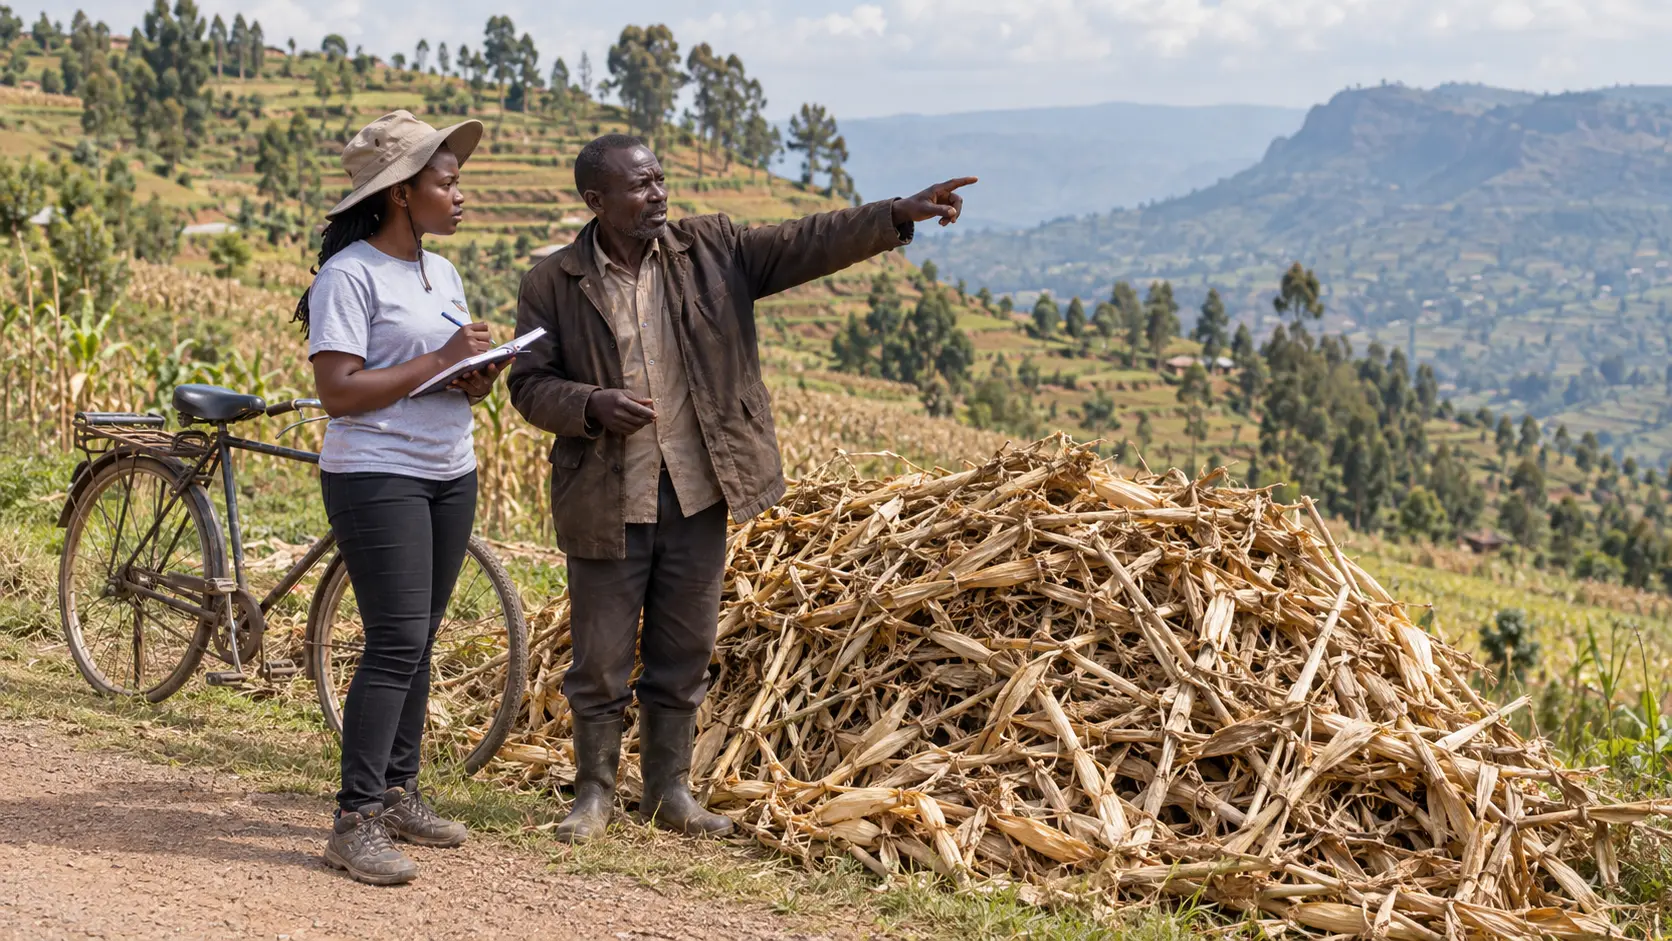
Roadside and field-edge grass that can be cut and carried. Neighbours' crop residues, which are often burnt or left because nobody asked. Communal grazing, if it exists.
At the trading centre and mill
This is where the by-products are. Work on Uganda's concentrate feeds value chain lists what circulates: maize and maize bran, sorghum, millet, rice bran, cassava and wheat bran as energy sources; soybean, sunflower cake, cottonseed cake, peas and groundnuts as protein sources; plus brewers' waste and yeast, silver cyprinids known as mukene, molasses, sugarcane tops and banana peels [11].
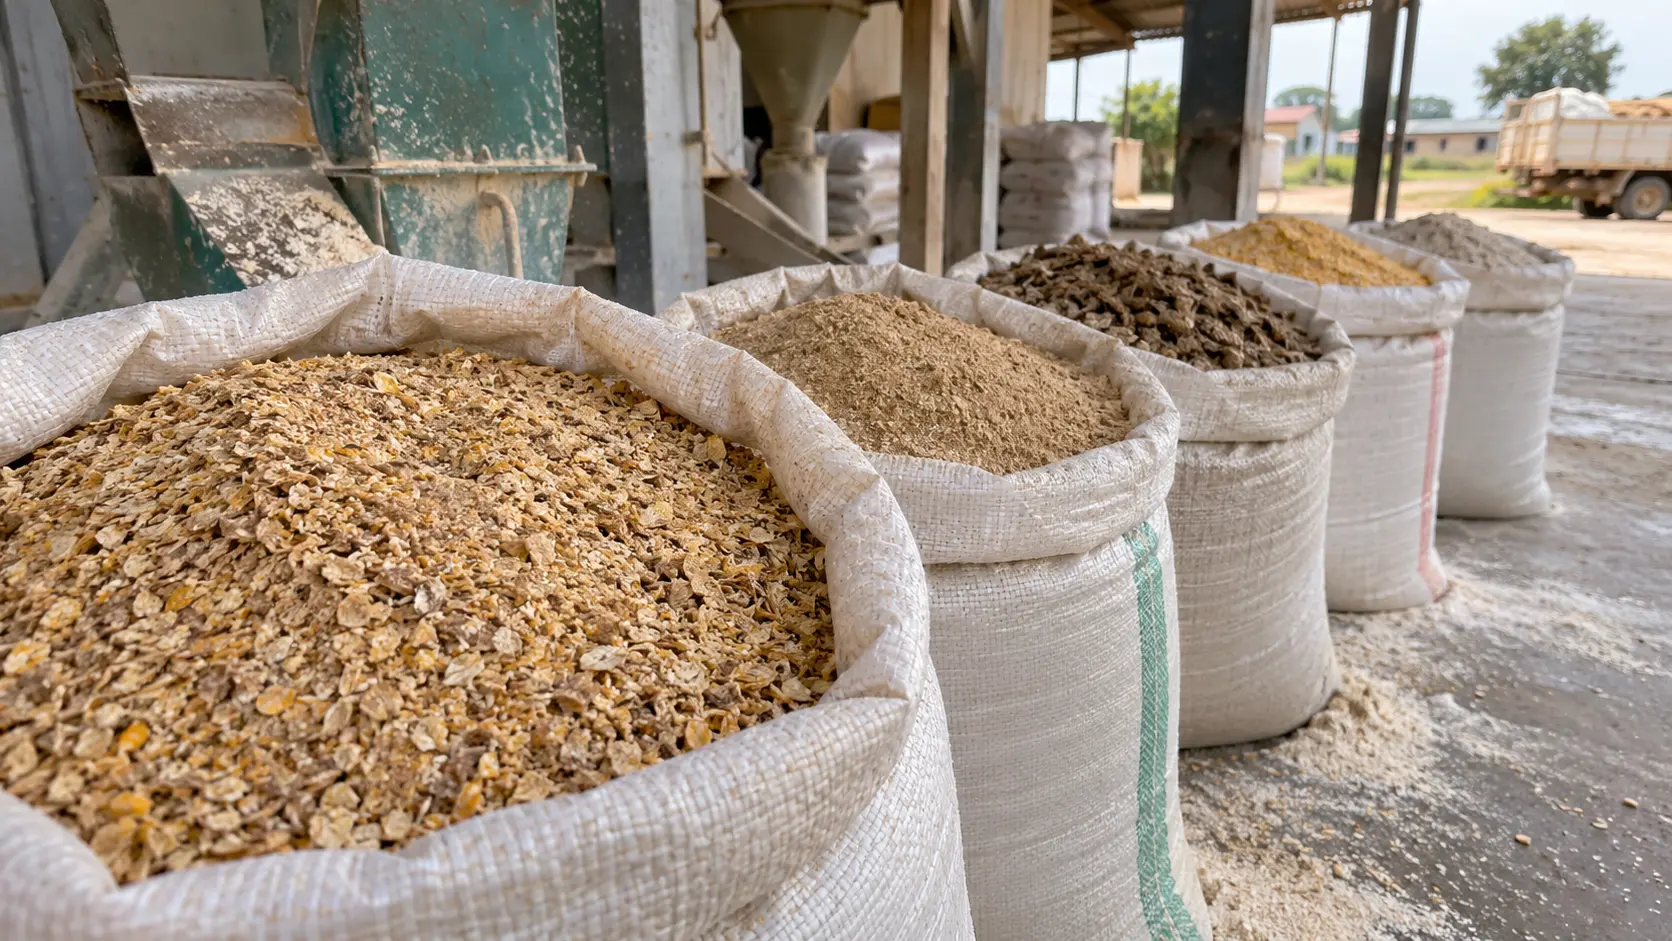
The scale can be substantial. That study records one Ugandan brewery producing 50 tonnes of brewers' waste per day [11]. It also found that only 33 per cent of dairy farmers used compounded concentrate while 56 per cent used straight materials such as maize or rice bran, and that dairy meal demand peaks in the dry periods of June to August and November to February, while poultry feed demand peaks from October to January [11].
Knowing those demand peaks tells you when prices will be worst, which tells you when to buy.
Estimating quantity without a weighbridge
You will not weigh a field of stover. You can estimate it.
FAO documentation reports observed maize residue to grain ratios at maturity of roughly 1.1 to 1.8 to 1 across varieties and harvests, and cites earlier work giving a straw to grain ratio for maize of 2 to 1 [12]. So if you harvested ten bags of maize grain, the residue from that field is in the same order of magnitude as the grain, and probably somewhat more.
That is not precision. It is enough to tell you whether a resource is worth organising or not.
Quality is part of the inventory
Availability without quality is misleading. A large quantity of very poor material may not be worth collecting.
Reference composition data is freely available from Feedipedia, a joint resource of INRAE, CIRAD, AFZ and FAO. A few examples that matter in Uganda:
- Maize stover: crude protein of 4 to 9 per cent, crude fibre around 30 per cent, and digestibility of about 52 per cent at harvest declining by roughly 1.5 percentage points per week in storage [13]. That decline is why collection timing matters.
- Sweet potato forage: fresh forage around 16.5 per cent crude protein, with dried aerial parts at 13.2 per cent protein and about 70 per cent digestibility [14]. Far better material than stover.
- Common bean straw: 5 to 11 per cent protein, crude fibre 38 to 45 per cent, with leaves much richer at around 20 per cent while stems are near 8 per cent and pod husks near 4 per cent [15]. Handling that keeps the leaves is worth the effort.
- Elephant grass: crude protein falling from around 21 per cent at 30 days of regrowth to under 4 per cent at 70 days, with fresh dry matter of only 12 to 16 per cent, and noted as supporting only about 7 to 8 litres of milk per cow per day when fed alone [16]. Cutting interval changes everything.
- Brewers grains: dehydrated material around 25.8 per cent crude protein, recommended up to 20 to 25 per cent of concentrate dry matter for dairy cattle [17].
- Maize bran: 9 to 15 per cent protein, but with a documented aflatoxin risk [18]. Store it properly or it becomes a liability.
Two materials on your list will need processing before they are safe. Cassava peels carry cyanogenic glycosides and must be sun-dried, ensiled or fermented before feeding [19]. Cottonseed products carry gossypol, which ruminants tolerate far better than other species [20]. Record these with a warning note attached and see our separate guides before feeding them.
Who owns it, and what else it is for
Do not assume that because material is lying in a field it is available to you.
Research on crop residue trade-offs in smallholder mixed systems found residue ownership varies by crop and by local institution, with some crops treated as a private resource and others as an open or group resource after harvest. It also documented genuine competition between uses: stall feeding, incorporation into the soil, fuel and open grazing, with the core tension that residues are usually an essential feed source, which restricts their availability for mulching [21]. That study covered sites in Ethiopia, Zimbabwe and India, not Uganda, so treat the pattern as instructive rather than local fact.
On communal grazing, Ugandan evidence is specific. A study of 94 communities across 29 districts, around 60 per cent of them within the cattle corridor, found only about a third of communities had active communal grazing land. Where it existed, use varied from 1.2 to 100 per cent of households with a median of 30 per cent, and the vast majority of patches were open year round, unguarded, and without use restrictions, governed by informal norms rather than written rules [22].
The pressure on that resource is real. The same study notes Uganda's cattle population roughly doubled between 2002 and 2008 [22]. Separate work reports that rangelands cover 44 per cent of Uganda's land area and sustain 80 per cent of the national livestock herd and 90 per cent of cattle, while grassland cover fell 9.2 per cent between 1990 and 2015, mainly through agricultural expansion [23].
If a communal resource appears on your inventory, mark it as uncertain and ask locally before you plan around it.
Limitations and when to get help
An inventory tells you what exists. It does not tell you whether a given animal can safely eat a given quantity of it. Feeding rates, especially for materials carrying anti-nutritional factors, require professional advice from a qualified animal nutritionist or veterinary officer.
Composition figures from Feedipedia are reference values from many samples worldwide. Your own material will differ, sometimes considerably, depending on variety, cutting stage and storage.
Do the walk twice, once in the wet season and once in the dry, before you rely on the grid.
What to do next
- Print or draw the twelve-month grid with the six feed categories down the side.
- Walk your own farm and list every residue, planted fodder and grazing area, with the months it is available.
- Walk the neighbourhood and add roadside cutting, neighbours' residues and any communal grazing, marking communal resources as uncertain [22].
- Visit the nearest mill, brewery outlet or oil processor and ask what by-products leave the site and when [11].
- Score overall feed availability from 0 to 10 for each month [2].
- Mark in a different colour the months scoring 4 or below. That is your shortfall.
- Repeat the walk in the opposite season before acting.
Read next: diagnosing where your feed money actually goes, crop residues as livestock feed, buying agro-industrial by-products, and building a twelve-month fodder calendar. Our published guide to year-round fodder planning for goats and cattle covers the underlying principle.