
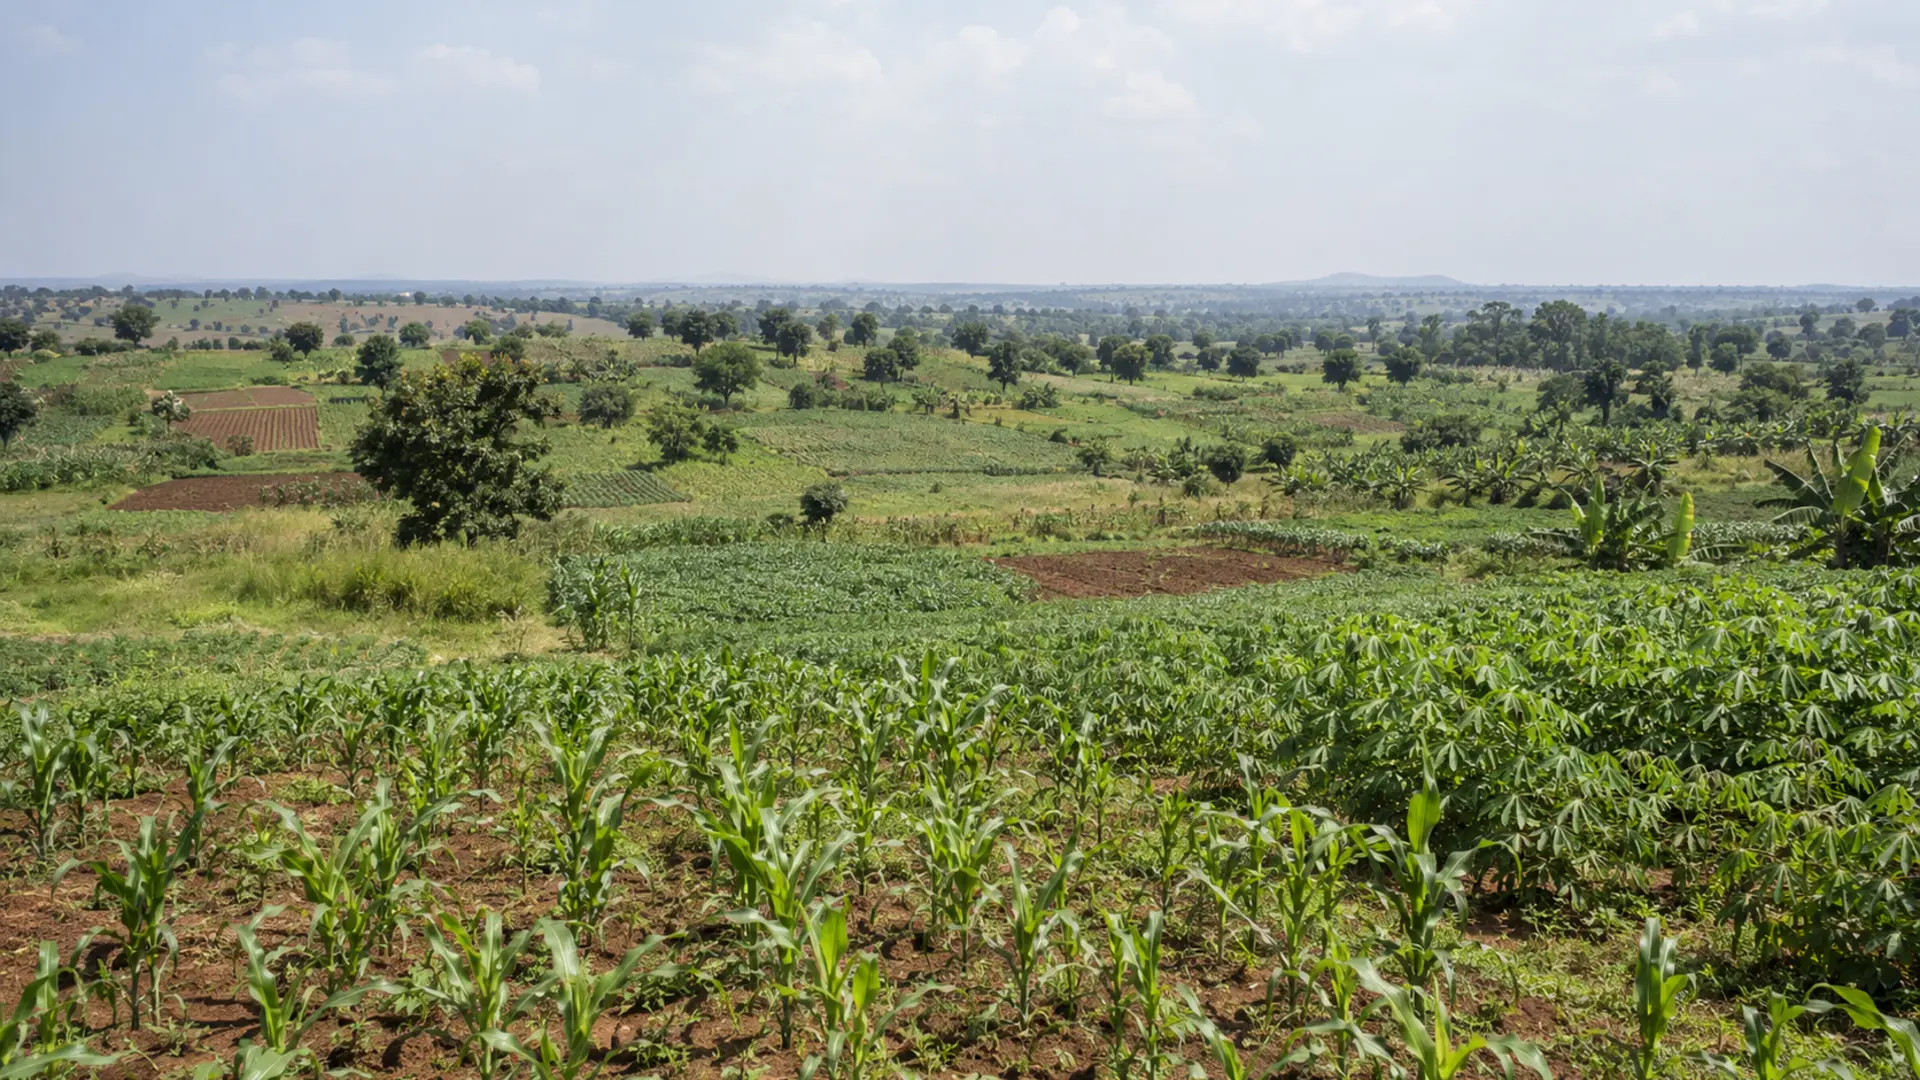
Somebody will offer you precision agriculture. A soil moisture sensor network. A drone survey. A satellite monitoring subscription. The pitch will be confident, the imagery will look impressive, and the question you are invited to ask is whether you can afford it.
That is the wrong question. The right one is whether the information would change anything you do.
This article is an evidence-weighing exercise rather than a technology showcase. It gives you a screening method that starts from the decision and works outward, sets out what the published evidence actually shows including where it is thin or absent, covers the Ugandan drone approval route, and describes what owning any of this requires after the purchase.
It names no vendor, no product and no service, deliberately. It does name public data programmes run by space agencies and international bodies, because those are public infrastructure whose specifications are published and checkable.
The honest starting point is a finding from a systematic review of precision agriculture in sub-Saharan Africa: “There is no known current application of the technologies amongst small-scale farmers that was identified in the current review.” The same review states that “Most of these technologies are, however, at the experimental stage, with only South Africa having applied them mainly in large-scale commercial farms.”
That is not a reason to dismiss the field. It is a reason to demand evidence rather than assume it.
The screening method
The method is a single sheet and the discipline is the order in which it is completed. Everything else in this article exists to help fill in two of its columns.
Farm Sensors, Drones and Satellite Data in Uganda: What They Are Actually Worth
A blank five-column screening worksheet running from the decision to be made, through the measurement that would change it, the cheapest way to obtain that measurement, whether a technology beats it, and the verdict.
The worksheet has five columns and they are filled in strictly left to right.
Column one: what decision am I trying to make? Not what would I like to know. What action would I take differently. Whether to irrigate today. Whether to apply more nitrogen to the eastern block. Whether to harvest this week or next. If you cannot name an action, stop.
Column two: what measurement would change that decision? This is the column that eliminates most proposals. Knowing the soil moisture at thirty centimetres changes an irrigation decision. Knowing a vegetation index across a field does not, on its own, change anything, because it does not tell you what to do differently. A measurement that does not have a decision rule attached to it is a picture, not information.
Column three: what is the cheapest way to get that measurement? Usually a person, a spade and half an hour. Sometimes a soil test. Sometimes a rain gauge. The cheapest method is the benchmark that any technology has to beat, and it is the benchmark that is almost never mentioned in a sales conversation.
Column four: does a technology beat that, and by how much? This is a question to put to the person selling, and to write their answer down. Not whether the technology is accurate, but whether it is enough better than column three to justify what it costs to own.
Column five: the verdict. Three possible answers, and “not yet” is a real one.
The rest of this article is material for columns three and four.
Soil moisture: the cheap method and the instrument
The commonest first purchase in on-farm technology is a soil moisture sensor, so it makes a good worked example.
What the instruments require. University extension guidance on maintaining and calibrating field-installed sensors is direct about it. “Soil moisture sensors need site-specific calibration for soil texture, bulk density, and salinity,” and “standard calibrations often fail in sandy, clay, and calcareous soils.”
Read that carefully. A sensor installed straight from the box, using its factory calibration, is documented as likely to be wrong in several common soil types. Calibration is not a refinement; it is a condition of the reading meaning anything.
It continues: “Sensors drift over time…and frequent recalibration is needed to avoid collecting inconsistent data.”
And on specific types: gypsum blocks “will dissolve over time in the soil and are expected to be replaced.” Tensiometers require “removing blockages, refilling water columns, checking seals, and verifying readings against manual measurements.”
Note that last phrase. The maintenance procedure for a tensiometer includes verifying it against manual measurements. The instrument does not remove the manual method; it depends on it.
The cheap method. Extension guidance describes the feel and appearance method: “Collect soil samples in the root zone with a soil probe or spade. Estimate the water deficit for each sample by feeling the soil and judging the soil moisture.” It notes that the method requires “frequent use to develop consistent estimates.”
The comparison nobody has published. We searched specifically for a study quantifying the accuracy of the feel and appearance method against instrumented readings, and found none in any accessible source. That is a clean negative finding and it cuts both ways. It does not show the manual method is as good. It does show that anybody telling you a sensor is more accurate than a trained hand is stating something that, as far as we could establish, has not been measured in a form we could read.
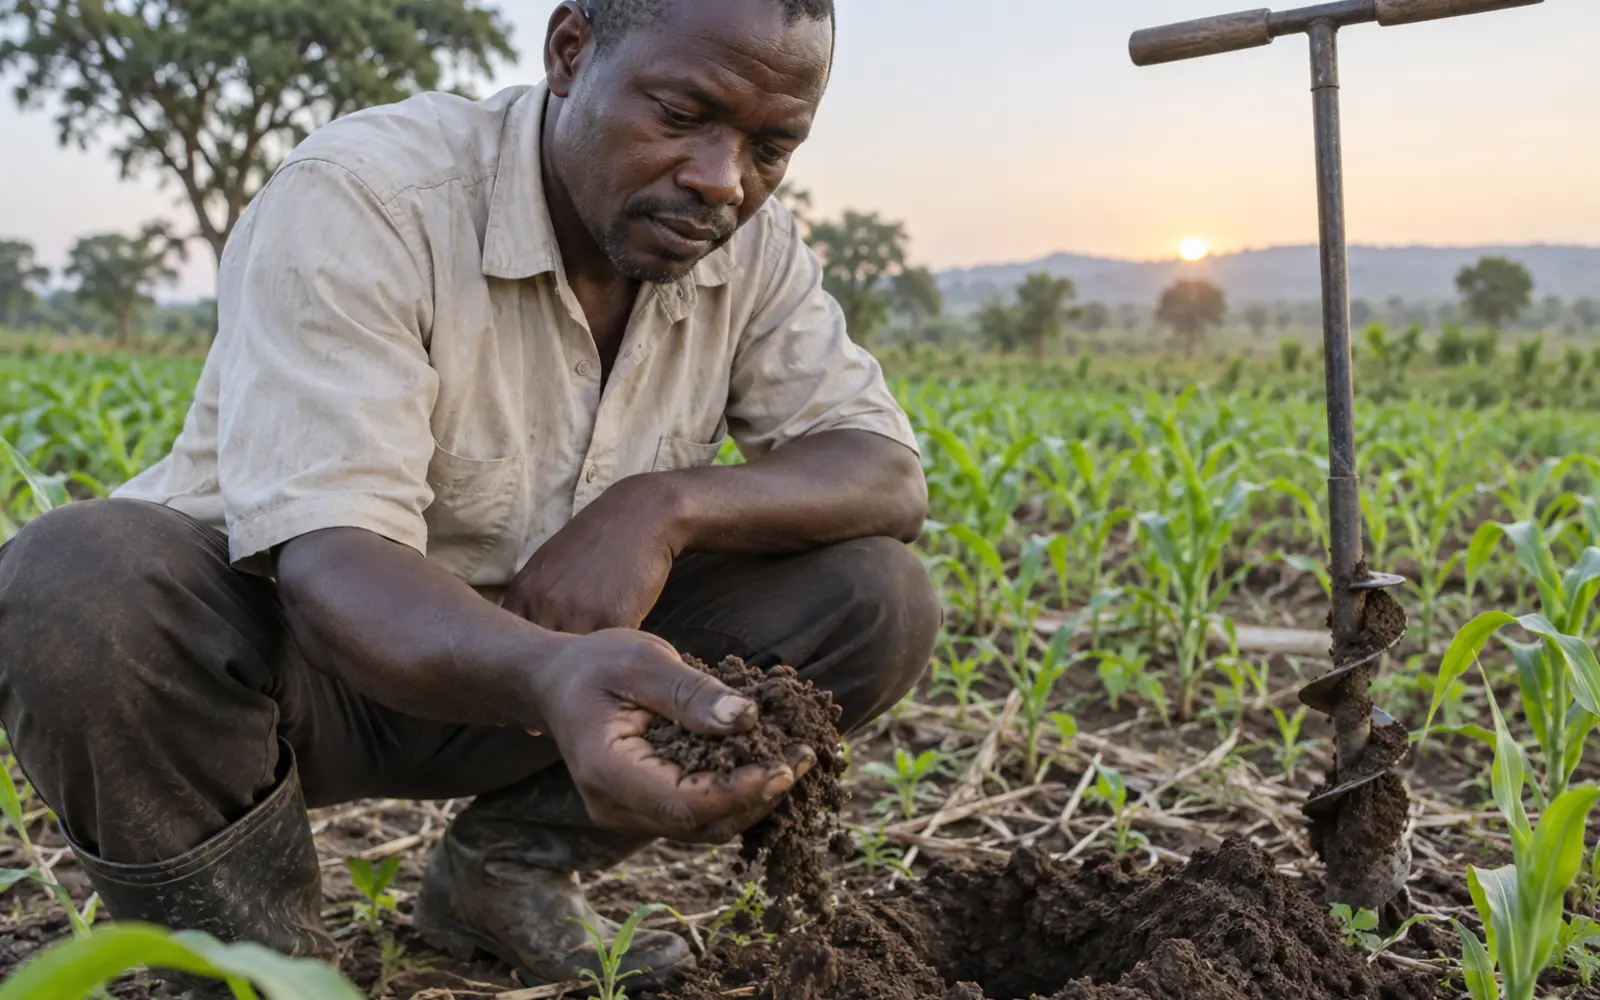
What column three looks like here. A person with an auger, checking at a fixed depth at fixed points on a fixed schedule, recording the result. That costs labour and nothing else, it requires no calibration, it does not drift, and it cannot run out of battery. A sensor has to beat that, on a farm where the calibration and recalibration will actually be done, before it earns its place.
What we could not find. No institutional or technical source gave a numeric lifespan in years for any sensor type. The only numeric lifespans we encountered were on vendor pages, which this article does not use.
Drones
Aerial imagery is the most visually persuasive of the three technologies and the one whose published agronomic results are weakest. Both halves of that sentence are evidenced below.
Farm Sensors, Drones and Satellite Data in Uganda: What They Are Actually Worth
A panel setting out five pieces of documented evidence on precision agriculture performance, each labelled with its geography, study type and whether the finding is positive, limited or negative.
What the agronomic evidence shows
A field trial in Ghana examined the relationship between drone-derived vegetation indices and maize yield in a smallholder system. The reported correlations were “r = 0.393” for maximum green normalised difference vegetation index at five weeks after planting, and “r = 0.372” for the mean, weakening further by nine to thirteen weeks. A ground-based chlorophyll meter performed worse at the same stage, at 0.259.
A correlation of 0.39 explains under sixteen per cent of the variation in yield. That is a real relationship and it is a weak one. The authors argue it still has value for early flagging, which is a fair position. It is not a basis for a management decision by itself.
The same trial documented operational limits worth quoting, because they are the things a demonstration flight never shows. “UAV flights routinely require clear and dry skies.” “Practical challenges such as crashes hampered the completion of three rounds.” And, most relevant to Ugandan farming systems, intercropping and mixed weed management “artificially increased NDVI metrics while reducing yields.”
That last finding deserves weight. In an intercropped field, a vegetation index can go up while yield goes down, because the index is measuring green material and not all of it is your crop. On a continent where intercropping is standard practice, that is a structural problem, not a calibration issue. The reasoning behind intercropping itself is covered in maize and beans intercropping.
The Ugandan evidence. The one Uganda-authored paper we found on drone-based crop phenotyping is a literature review rather than a trial. It reports that “cereals have been the most studied crop for drone based phenotyping application” while root crops were least studied, and that there have been “limited studies… focused on the effect of drones’ operation parameters.” It contains no Ugandan field results, because it is not a field study.
No Ugandan drone agronomy trial with quantified on-farm results was located.
What Ugandan regulation requires
Before any agronomic question arises, there is an administrative one, and it is more substantial than most prospective operators expect.
Farm Sensors, Drones and Satellite Data in Uganda: What They Are Actually Worth
A process diagram of the Ugandan drone importation and operation approval route with the required documents, the bodies involved and the stated fee, plus a panel of what could not be verified.
The governing instrument is the Civil Aviation (Unmanned Aircraft Systems) Regulations, 2022, assented on 12 August 2022.
The operative procedure is described in the Civil Aviation Authority’s own advisory circular, reference UCAA-AC-UAS001, Issue 1, July 2020.
For importation, the circular describes a route in which the revenue authority’s customs function submits requests to the aviation authority, the authority evaluates for preliminary compliance and contacts the Chief of Defence Forces, a tripartite committee convenes to evaluate, clearance or rejection is communicated back, and the authority then clears importation and notifies the applicant.
For operation, the requirements are a “letter of no objection from the relevant line ministry” regarding the planned operations, submission to the aviation authority of “a request for approval of the drone operation on Form: AC - UAS 001 together with the letter of no objection from the relevant line ministry,” a security clearance process through the same tripartite committee, payment of an authorisation fee stated as “Ushs 250,000 + 18% VAT” at the authority’s Entebbe office with the receipt submitted to headquarters, and a safety evaluation by the authority before final approvals are communicated.
Three honest qualifications.
We could not open the 2022 regulations themselves. The instrument’s title and assent date are confirmed. Its substantive provisions were not readable in any copy available to us.
We are not reproducing the numeric limits that circulate. Figures for maximum aircraft weight, maximum altitude and minimum standoff distance appear on non-official drone law summary sites. They are not verified against the primary text and this article does not repeat them. If you are planning operations, those figures come from the authority, not from an article.
The relationship between instruments is unclear. Some secondary sources refer to a separate 2020 remotely piloted aircraft systems instrument. Whether that exists distinctly, was superseded, or is a conflation, we could not establish.
What a prospective operator should take from this section is the shape of the burden rather than its detail: a letter from a line ministry, a security clearance through a defence committee, a fee, and a safety evaluation, for each operation. That is the maintenance cost of the technology in administrative rather than mechanical terms, and it belongs in column four.
Satellite data, and the pixel problem
Satellite imagery is free, which makes it the easiest of the three to try and the hardest to evaluate honestly. The specifications are published, so the evaluation can be done with arithmetic.
Farm Sensors, Drones and Satellite Data in Uganda: What They Are Actually Worth
A table of satellite and weather product specifications alongside a scale diagram comparing a typical Ugandan holding against the ground area of a single pixel from each product.
The specifications
The European optical constellation samples “13 spectral bands: four bands at 10 m, six bands at 20 m and three bands at 60 m spatial resolution,” with two satellites giving “a high revisit frequency of 5 days at the Equator” and an orbital swath width of 290 kilometres.
The United States optical programme provides “30 m (VSWIR and SWIR), 15 m (panchromatic), 100 m (TIR),” with an individual satellite revisit of 16 days and a combined two-satellite revisit of “every 8 days.”
The commonly used rainfall product has a cell size of “0.05” degrees, roughly five kilometres, at daily and monthly temporal resolution. The meteorological and solar product operates at “1.0 degrees latitude by 1.0 degrees longitude for the radiation data sets and half a degree latitude by five eighths of a degree longitude for the meteorological data sets,” which is grid cells of roughly fifty to seventy kilometres.
Why that matters in Uganda specifically
Uganda’s Annual Agricultural Survey reports that “the average holding size has increased over the last decade reaching an average area of 1.3 Ha per household compared to 1.1 Ha in the 2008/09 Uganda Census of Agriculture,” and that “67 percent of Ag HHs operating less than 1 Ha of agricultural land.”
Set those two sets of figures side by side and the arithmetic is stark.
A ten metre pixel covers one hundred square metres. An average Ugandan holding of 1.3 hectares is 13,000 square metres, so roughly 130 pixels at the finest free optical resolution, spread across however many separate plots and crops the household grows. A thirty metre pixel covers nine hundred square metres, giving about fourteen pixels for the whole holding. A five kilometre rainfall cell covers 2,500 hectares, which is around 1,900 average Ugandan holdings in one number. A meteorological grid cell at fifty to seventy kilometres is larger than many districts.
A peer-reviewed methods paper states the general problem directly: “Half of all fields in Africa’s smallholder-dominated agricultural systems are smaller than 1 ha,” and the “30-250 m resolution of the sensors typically used in many landcover mapping efforts… results in errors due to mixed pixels” along with the “modifiable area unit problem, wherein the pixel’s shape does not match that of crop fields.”
The same paper notes that even 3.7 metre commercial imagery was described as only “sufficiently resolved for humans to discern small fields under many conditions,” which implies automated classification at ten to thirty metres is materially worse.
The practical conclusion. Satellite monitoring of an individual Ugandan smallholder plot, using free imagery, is working at or beyond the limit of what the resolution supports. That does not make satellite data useless. It makes it a district and landscape tool rather than a plot tool, and the distinction determines which decisions in column one it can ever serve.
Cloud, which is the other half of the problem
Optical satellites cannot see through cloud, and Uganda sits on the equator.
A pan-tropical study across 168 tropical countries between 2017 and 2021 reports a “median cloud-free observations per year: 49,” or roughly four per month. A study including a cloudy equatorial African location found that for that site “the 12 least cloudy Sentinel-2 acquisitions in 2019” were selected from “68 available images,” which is around eighteen per cent usable. The same work states that “the persistent cloud cover, cloud shadows and haze frequently result in no exploitable images over large areas for weeks or even months.”
An honest limitation. Neither figure is Ugandan. The second comes from Equatorial Guinea. We searched for a Uganda-specific or East Africa-specific study quantifying cloud-free image frequency and found none. That is a genuine gap in a question that matters enormously here, and it is reported rather than estimated.
What it means for a purchase decision is that a five-day nominal revisit is not a five-day effective revisit anywhere in the equatorial tropics, and a monitoring service sold on nominal revisit frequency should be asked what it delivers in practice over a Ugandan location across a full season.
Rainfall products
A validation study of a widely used rainfall product over equatorial East Africa found that it performs “best at the monthly and annual time steps,” with an annual correlation of 0.84 and roughly one per cent underestimation. At the daily scale, the correlation falls to 0.22, and the product misses “98%” of daily extreme rainfall events. The authors conclude it “cannot be recommended for return value analysis.”
That is a single product with two entirely different verdicts depending on the question. For seasonal water balance planning, it is good. For knowing whether a damaging rainfall event happened on a particular day at a particular place, it is not. Any use of it on a farm has to specify which question is being asked.
A validation of the solar and meteorological product over Ghana reported correlations of “r = 0.6-0.94” with root mean square error of “0.13-0.46 kWh/m2/day” and mean percentage error of “1.11-6.34%,” with performance “weakest over the southern half Forest-type climate.” Again, not Ugandan, and weakest in the humid conditions most like parts of Uganda.
The one Ugandan satellite study. Work published in 2025 examining vegetation and water stress indices over Uganda found that a standardised vegetation index “had a strong positive correlation with SPEI-03 over cropland, grassland, and forest lands.” Note what that is: a correlation between two satellite-derived indices, not between a satellite product and a farm outcome. It does not tell a farmer what a measurement is worth.
The broader question of how to use rainfall records and forecasts for actual farm planning is dealt with in rainfall records and seasonal forecasts.
What ownership actually requires
This is the section that the pitch does not include.
Farm Sensors, Drones and Satellite Data in Uganda: What They Are Actually Worth
A panel of the documented ongoing requirements of sensor and data technology ownership covering calibration, drift, consumable replacement, connectivity, power and data handling, with the Ugandan baseline figures alongside.
Calibration and recalibration, as documented above, is a recurring task requiring soil-specific work and verification against manual measurement.
Consumables and servicing, as documented, include replacement of dissolving sensor elements and routine servicing of water-column instruments.
Connectivity. A networked device needs a network. Data reported from the national regulator states that “77% of the population are covered by 3G and 31% by 4G, while 53% of the country’s geography are covered by 3G and 24% by 4G.”
Note the gap between population and geography. Farms are in the geography, not the population centres. Twenty four per cent of Uganda’s land area under the newer network generation is the relevant figure for a field device, not the seventy seven per cent population figure.
Power. An international energy body reports that “around 20% of the Ugandan population had access to electricity from the national grid, while a further 10% received electricity from solar home systems,” with a further “20% benefitted from limited access through smaller solar lighting devices,” and notes that “scattered and sparse settlement patterns of the predominantly rural population compound the cost and complexity” of electrification.
And the maintenance evidence gap. We looked hard for a post-project evaluation of an African agricultural sensor or ICT deployment reporting what fraction of the installed equipment was still functioning after the project ended. We found none.
What we did find is a peer-reviewed account of ground-based weather station networks in Africa reporting that stations “are sparse and their numbers have been declining over the last half-century,” that automatic stations face “high maintenance needs that require spare parts that may not be available locally,” and that even where data is collected it “are in different formats and may sit on different servers,” preventing effective use. The same source reports quality control flag rates on one national dataset of 6.4 per cent for relative humidity, 3.7 per cent for temperature, 1.7 per cent for radiation and 0.99 per cent for precipitation.
Those are institutionally supported networks with national meteorological services behind them. If they face chronic spare parts, fragmentation and data quality problems, a reasonable prior for a farm-level deployment without that support is not more optimistic. That is an inference and it is labelled as one.
Where this leaves an investor or a policymaker
For a farm manager, the conclusion is the screening table. Fill it in from the left. Most proposals will not survive column three.
For an investor, three questions follow directly from the evidence above. What Ugandan on-farm outcome has this technology been shown to change, with a published figure? How does it perform under cloud, intercropping and plot sizes at the scale it will operate in? And what is the documented plan for calibration, replacement and connectivity over the asset life? The wider framework for that kind of examination is in agricultural investment due diligence.
For a policymaker or a lecturer, the most useful finding in this article is the absence. A systematic review found no known current application among small-scale farmers in the region. No Ugandan trial reporting a quantified on-farm result from sensors, drones or satellite monitoring was identified. No post-project survival evaluation exists. That is a research agenda described by its gaps, and those gaps are more useful to state than to paper over.
The short version
Start from the decision, not the device. If you cannot name the action that would change, the technology cannot help you.
Benchmark against a person with a spade. The manual methods are cheap, robust and, on the evidence available, not documented as inferior.
Treat calibration and maintenance as the real cost. Documented drift, documented recalibration, documented replacement, and connectivity and power baselines that constrain everything.
Understand the resolution arithmetic. A typical Ugandan holding is a few dozen pixels at free optical resolution and a fraction of a pixel in a rainfall product.
Assume cloud will take most of your images, and ask any service what it actually delivered over a Ugandan site across a full season.
And ask for the Ugandan evidence. If there is none, that is not a reason never to try something. It is a reason to try it small, measure it against the cheap method, and keep the record yourself.
Author: Falcon Foundation Ltd Editorial Team
The Falcon Foundation Ltd Editorial Team produces evidence-based agricultural guidance for Ugandan farmers, drawing on published research and institutional sources and translating them into practical decision support. Where evidence is unavailable or contested, we say so rather than filling the gap.