
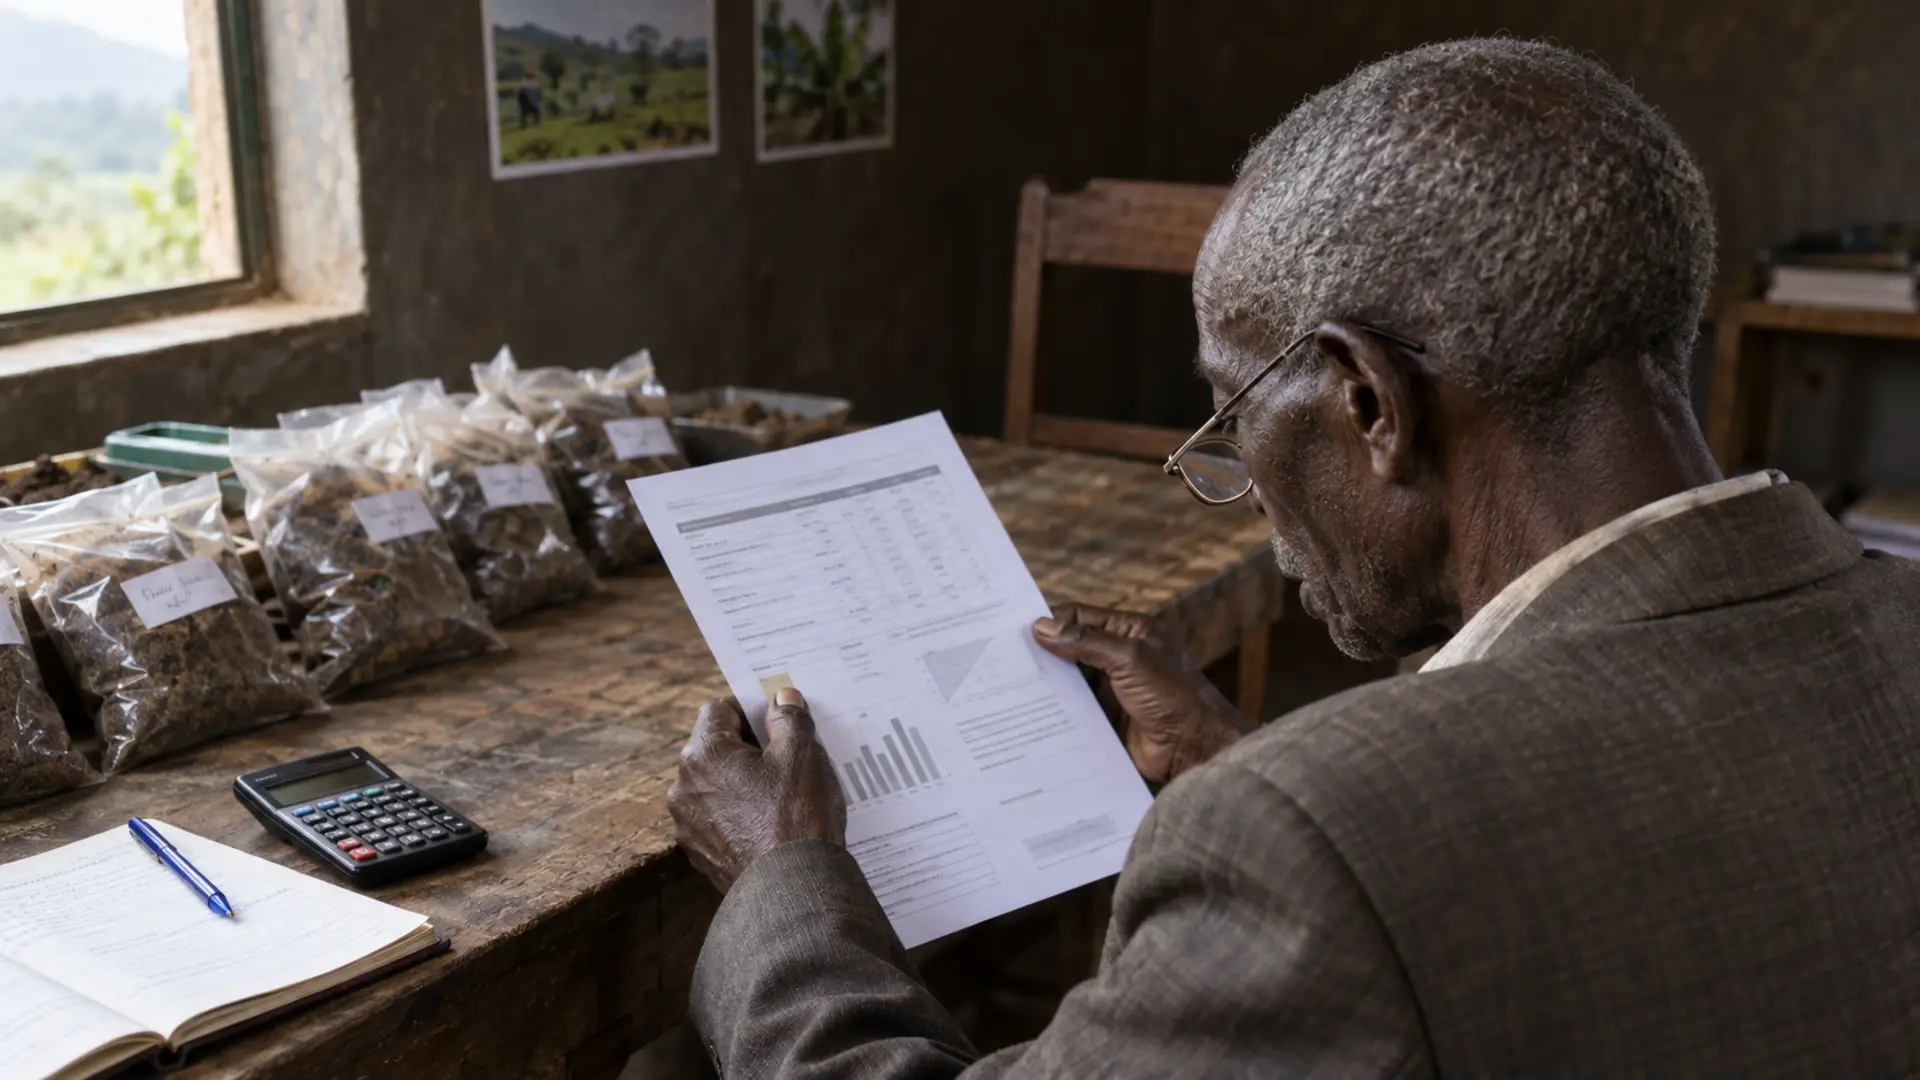
The report comes back. There is a column of abbreviations, a column of numbers and a column of units, and no sentence anywhere telling you what to do.
So it gets folded, put in a file, and the next season is farmed exactly like the last one. The test was not the hard part. The interpretation was, and nobody supplied it.
This guide goes through the report line by line and finishes with a ranked list of actions.
What this guide helps you decide
By the end you should be able to read each parameter on a standard report and say what it measures, which direction matters and what you would do about it; understand why a phosphorus number cannot be compared with a threshold from a different laboratory method; and rank what the report tells you into an order of work.
It does not cover how to take and submit a sample, which is a separate published guide, and it does not cover choosing fertiliser products, which is another.
The short answer
Before you read a single number, find the extraction method on the report and write it down. Then work through the parameters in this order: pH first, because it controls everything else, then texture and cation exchange capacity, because they tell you how to apply rather than what, then organic matter, then the nutrients themselves.
Rank your actions the same way. Fix what limits root growth first. Then fix what limits nutrient availability. Only then add nutrients.
And know the honest limitation before you start: we could not find a published Ugandan set of interpretation classes covering a full soil report. Ugandan laboratories interpret against thresholds calibrated elsewhere, and that is a real constraint on what any report can tell you here.
The gap you should know about before you read your report
We searched for an official Ugandan interpretation table, published by NARO, the ministry or a university, giving low, medium and high classes for pH, organic matter, nitrogen, potassium, calcium, magnesium, cation exchange capacity and base saturation for Ugandan soils. We did not find one.
What we did find were two Ugandan studies converging on a single Bray-1 available phosphorus critical value of about 15 parts per million. A study of finger millet growing areas in eastern Uganda, analysed at the Makerere soil laboratory using the Bray-1 method, reported available phosphorus of 5, 4.7 and 2.2 parts per million against a stated critical value of 15 parts per million for legumes and 20 for cereals, and total nitrogen of 0.12 to 0.175 per cent against a stated critical value of 0.25 per cent. A separate legacy phosphorus study in Uganda, also using Bray-1 at 0 to 20 centimetres depth, found that the majority of rainfed fields in Masindi had soil test phosphorus below a critical concentration of 15 parts per million, while irrigated fields in Kasese showed phosphorus surpluses as high as 214 kilogrammes of phosphorus per hectare.
Those are real Ugandan reference points. They are also specific to Bray-1, and to the crops and soils studied, which is exactly the point the next section makes.
Where do Ugandan reports come from? NARO’s National Agricultural Research Laboratories at Kawanda list soil testing analysis among their services, under a soils, environment and agro-meteorology programme. Makerere University operates a soil laboratory and has separately developed a low-cost field test kit, though a validation study of that kit found its organic matter, pH, phosphorus and potassium results differed significantly from standard laboratory methods, with only nitrogen agreeing, and concluded that more work on its ranges was needed. We could not verify a fee for either institution and will not quote one.
The most important thing on the page is not a number
Somewhere on your report there is a line naming the extraction method used for phosphorus. It might say Bray 1, Bray 2, Mehlich 1, Mehlich 3 or Olsen. If it does not say, ring the laboratory and ask.
Here is why it matters more than the number beside it.
Phosphorus in soil is held in different chemical forms depending on the soil’s own chemistry. FAO’s global soil laboratory network notes that higher percentages of aluminium-bound and iron-bound phosphorus occur in acid soils, and a higher percentage as calcium-bound phosphorus in neutral to alkaline soils. Each extraction method is a chemical designed to attack a particular set of those forms. They are not measuring the same pool.
The consequences are practical. Bray-1 uses an acid fluoride extractant and works well on soils below about pH 7.3, but tends to underestimate available phosphorus on calcareous soils where the extractant may fail. Olsen uses bicarbonate and is the method required on calcareous soils. Mehlich-3 was designed as a more universal extractant, and its critical values sit near but slightly above those normally used for Bray-P1, but it still needs specific local calibration: in one United States region it returned results eight to ten times higher than expected and was not approved for use there.
The authoritative warning is unambiguous. Using a single factor or equation to convert amounts of phosphorus extracted by one method into amounts extracted by another often yields wrong estimates.
You can see this in published interpretation tables. One American state extension guide gives, for the same crops, Bray P1 classes of low below 20 parts per million, medium 20 to 40 and high 40 to 100, alongside Olsen classes of low below 10, medium 10 to 25 and high 25 to 50. Same soil, different method, different boundaries.
So: find the method. Then find a threshold set calibrated for that method. Never mix them.
The report, parameter by parameter
pH. How acidic or alkaline the soil is. It matters more than anything else on the page because it governs the availability of most other nutrients and, at the low end, brings aluminium into solution where it damages roots. Direction that matters: low. Practical response: if pH is low, that is your first action, and the detail belongs in the guide on acid soils and liming. Fixing pH makes every other nutrient on the report work harder without buying any more of them.
Organic carbon and organic matter. Usually one is measured and the other calculated. The conventional conversion multiplies organic carbon by 1.724 to give organic matter. Know that this factor is weaker than it looks. It was proposed by Wolff in 1864 without supporting evidence, from an earlier finding that humic acid is about 58 per cent carbon, and it is commonly misattributed. Measured values of the true factor range from 1.4 to 2.5 with a median around 1.9. Direction that matters: low. Practical response: organic matter is a slow lever. Compost, residue return, cover crops and manure all raise it, over years rather than seasons. Some interpretation guides do not even give organic matter a fertility class, using it only to estimate how much nitrogen a soil will supply.
Total nitrogen. A weak predictor of what the crop can actually get. Nitrogen moves quickly through soil, and total nitrogen mostly measures nitrogen locked in organic matter that will only become available as that matter breaks down. One major extension service does not soil test for nitrogen at all for this reason, basing recommendations on crop need instead. Where a report does give available nitrate nitrogen, note that the value reflects what is immediately available, not what will come from mineralisation, and not what may be lost to leaching or denitrification. Direction that matters: low. Practical response: manage nitrogen through timing, splitting and organic matter rather than through a single soil figure.
Available phosphorus. Covered above. Direction that matters: low. Practical response: compare only against a threshold for the same extraction method, then correct if below it. Note that phosphorus corrections are usually treated as a building exercise over about three years where levels are below optimum, and as simple replacement of what the crop removes where levels are at optimum.
Exchangeable potassium, calcium and magnesium. The three main exchangeable cations. Direction that matters: low for potassium generally; for calcium and magnesium, the balance matters as much as the amount, but see the caution below. Practical response: correct genuine deficiencies, and read the base saturation line alongside these rather than instead of them.
Cation exchange capacity. This is the parameter most often ignored and one of the most useful. It measures the soil’s capacity to hold and supply exchangeable nutrient cations, and it is largely a function of clay content and organic matter. Published ranges by texture, from different sources and so with different boundaries: sand around 1 to 5, sandy loam around 5 to 10, loam around 5 to 15, silt loam around 10 to 18, clay loam around 18 to 24, and clay above 24 to 30, in centimoles of charge per kilogramme, which is the same as milliequivalents per 100 grammes. Sandy soils low in organic matter can be below 3.
Direction that matters: low. Practical response, and this is the useful part: a low cation exchange capacity changes how you apply rather than what you apply. A large one-time addition of a cation such as potassium on a low-capacity soil leads to large leaching losses. More frequent additions of smaller amounts are better. If your report shows a low cation exchange capacity, split your applications.
One further note: cation exchange capacity is relatively constant, so there is no need to have it analysed repeatedly.
Base saturation. The percentage of the exchange capacity occupied by the basic cations calcium, magnesium and potassium. One published guide gives ideal ranges of calcium 65 to 80 per cent, magnesium 10 to 20 per cent, potassium 2 to 7 per cent and sodium below 1 per cent, and warns that magnesium saturation above 20 per cent can adversely affect soil structure, water infiltration, drainage and aeration.
Now the caution, because this is where a great deal of money is wasted. There is a school of thought that soil should be managed to achieve an ideal ratio between calcium, magnesium and potassium. A published review of that theory found that the common outcome of every study examined was to refute the existence of an ideal ratio or a balanced soil, cited research finding that a sufficiency-level approach produced the most economic yields compared with the alternatives, and noted that ratio-based management can cause expensive overapplication of soil amendments with no yield benefit. Crops have been shown to grow to maximum yield over a wide range of cation ratios. Mainstream extension guidance works from sufficiency levels rather than ratios.
Read base saturation, note anything extreme such as very high magnesium, and do not let anyone sell you amendments to hit a ratio.
Texture. Sand, silt and clay proportions. Direction: not better or worse, but it sets your expectations for everything else, particularly water holding and cation exchange capacity. Practical response: use texture to sanity-check the rest of the report. A sandy soil reporting a very high cation exchange capacity deserves a question to the laboratory.
Units, and the conversion that trips people up
Parts per million and milligrammes per kilogramme are the same thing. One part per million is one milligramme of the element in one kilogramme of soil. If your report gives one and a threshold gives the other, no conversion is needed.
Centimoles of charge per kilogramme and milliequivalents per 100 grammes are also the same thing. Older reports and older interpretation tables use the second. They are numerically identical.
Per cent is per cent. Organic matter and total nitrogen are usually reported this way.
Converting parts per million to a per hectare figure requires two assumptions. A parts per million figure is a concentration. A kilogrammes per hectare figure is a quantity, and to get from one to the other you have to decide how much soil you are talking about. That means assuming a sampling depth and a bulk density.
You can see the depth dependency directly in published guidance. One American laboratory’s formula for nitrate nitrogen converts parts per million to pounds per acre by multiplying by the sampling depth increment divided by three, then by 0.3. The depth term is there because doubling the depth doubles the mass of soil.
Two practical rules follow. First, always record the sampling depth on the report and use the same depth every time, or your results are not comparable year to year. Second, treat any per hectare figure as resting on an assumed bulk density, and ask your laboratory what they assumed. A compacted soil and a loose one at the same depth do not weigh the same.

Building the ranked action list
Work through the report and write each finding on a line. Then rank them in this order.
First, anything limiting root growth. Low pH heads this list. So does anything the report or your own observation suggests about compaction or waterlogging, which a soil report will not show but which makes everything else irrelevant.
Second, anything limiting nutrient availability. Low pH again, from the other direction. Very high magnesium saturation, if present, because of its effect on structure and infiltration.
Third, anything limiting nutrient supply. Phosphorus below the critical value for the stated method. Potassium below sufficiency. These are the ones people jump to first, and they are third.
Fourth, the slow levers. Organic matter. These start now and pay later.
For each line write what you will do and which season you will do it in. A ranked list of four things you will actually do beats a list of twelve you will not.
Costs
No fees, because we could not verify any. The cost categories are:
- The analysis itself, per sample, from the laboratory you choose
- Transport of samples to the laboratory
- The number of samples, which is driven by how many distinct areas your farm has, not by its size
- Any lime or amendment the report leads you to
- Fertiliser, adjusted for what the report showed
- Repeat testing at whatever interval you settle on
- Your own time, which is the largest cost of a report you never act on
How often to test again
There is no single interval. Published guidance scales it to how fast the parameter changes and what you are growing: annual vegetables and intensive systems every one to two years, perennial crops every three to five, with a general range of one to five years for specialty crops. Cation exchange capacity does not need repeating. Nitrogen, being mobile, is a seasonal question rather than a multi-year one.
The one rule that applies everywhere: sample at the same time of year every time, from the same depth, so that your results can be compared with each other.
Common mistakes
Comparing a phosphorus number with a threshold from a different method. The single most common and most expensive error in reading a soil report.
Ignoring the sampling depth. Without it, no per hectare figure means anything and no two reports are comparable.
Buying fertiliser before fixing pH. Nutrients applied to an acid soil are partly wasted.
Chasing a cation ratio. The research refutes the idea of an ideal ratio, and the amendments are expensive.
Reading total nitrogen as though it were available nitrogen. It is not, and the report usually says so if you read the parameter name carefully.
Treating a foreign interpretation table as a Ugandan one. They are what we have, and they should be used knowingly rather than silently.
Retesting cation exchange capacity every year. It barely moves. Spend the money on another sample from a different part of the farm instead.
Warning signs and escalation points
- A pH low enough that aluminium toxicity is plausible, which needs the liming decision taken properly rather than by guesswork
- A result that contradicts what you can see in the field, such as high nutrient levels in a visibly failing crop, which usually points to a physical problem the report cannot show
- Wildly different results from two samples taken from the same field, which means the sampling was not representative
- A report with no extraction method stated, which should go back to the laboratory before you act on it
- Any figure that does not fit the texture, such as a very high exchange capacity on a sandy soil
- A recommendation from a supplier that does not reference the method used on your report
Where this works, and where it does not
It works for a farmer or manager holding a report from a laboratory that states its methods, on a field sampled properly, who wants to convert numbers into decisions.
It works less well in three situations. Where the report gives no method, most of what is written here cannot be applied and the report should go back. Where the sampling was not representative, the interpretation is confident nonsense, and the sampling guide matters more than this one. And where the limiting factor is physical, such as compaction, waterlogging or shallow soil over rock, the chemistry will look fine and the crop will still fail.
The evidence limitation is worth repeating plainly, because it changes how you should hold any number in this article. There is no published Ugandan interpretation class set covering a full report that we could find. The Bray-1 phosphorus critical value of around 15 parts per million is the one Ugandan reference point that appears independently in more than one study, and even that is specific to Bray-1 and to the crops and soils in those studies. Every other class boundary quoted here comes from foreign extension services, calibrated on foreign soils, and is offered as the best available guidance rather than as a Ugandan standard.
A low-risk first step
Take out the report you already have and do one thing: find the extraction method for phosphorus and write it at the top of the page in large letters.
If it is not on the report, ring the laboratory and ask, and write down what they say. That single piece of information decides whether the phosphorus figure on your report can be compared with anything at all, and it takes one phone call.
While you have them on the line, ask two more things: what sampling depth the result refers to, and what bulk density they assume in any per hectare figure. Those three answers make the rest of the report readable.
What to do next
- Write the extraction method, the sampling depth and the assumed bulk density on the face of the report.
- Work down the report and note, for each parameter, what it measures and which direction matters.
- Build the ranked action list: root growth first, availability second, supply third, slow levers fourth.
- If pH is low, make that the first action and take the liming decision properly.
- If cation exchange capacity is low, change your application pattern to smaller and more frequent, whatever else you do.
- Fix a retest interval and a fixed sampling month, and write both in your records.
- Take the report to your district agricultural officer or the laboratory and ask them to walk through anything you could not interpret.
Related reading: the published guide to soil testing and fertility covers taking and submitting the sample, and fertiliser types and quality verification covers what to buy once you know what you need. For the pH question specifically, see acid soils and liming, and for trace elements, diagnosing micronutrient problems. The published guides to composting and organic matter and crop rotation and cover crops cover the slow levers.
About the author
This guide was researched and written by the Falcon Foundation Ltd Editorial Team. Falcon Foundation Ltd is a privately owned Ugandan agricultural company producing greenhouse crops, livestock and honey. Our Knowledge Hub is written for Ugandan farmers making practical decisions with incomplete information. Where an interpretation threshold comes from outside Uganda, we say so rather than presenting it as a local standard.