
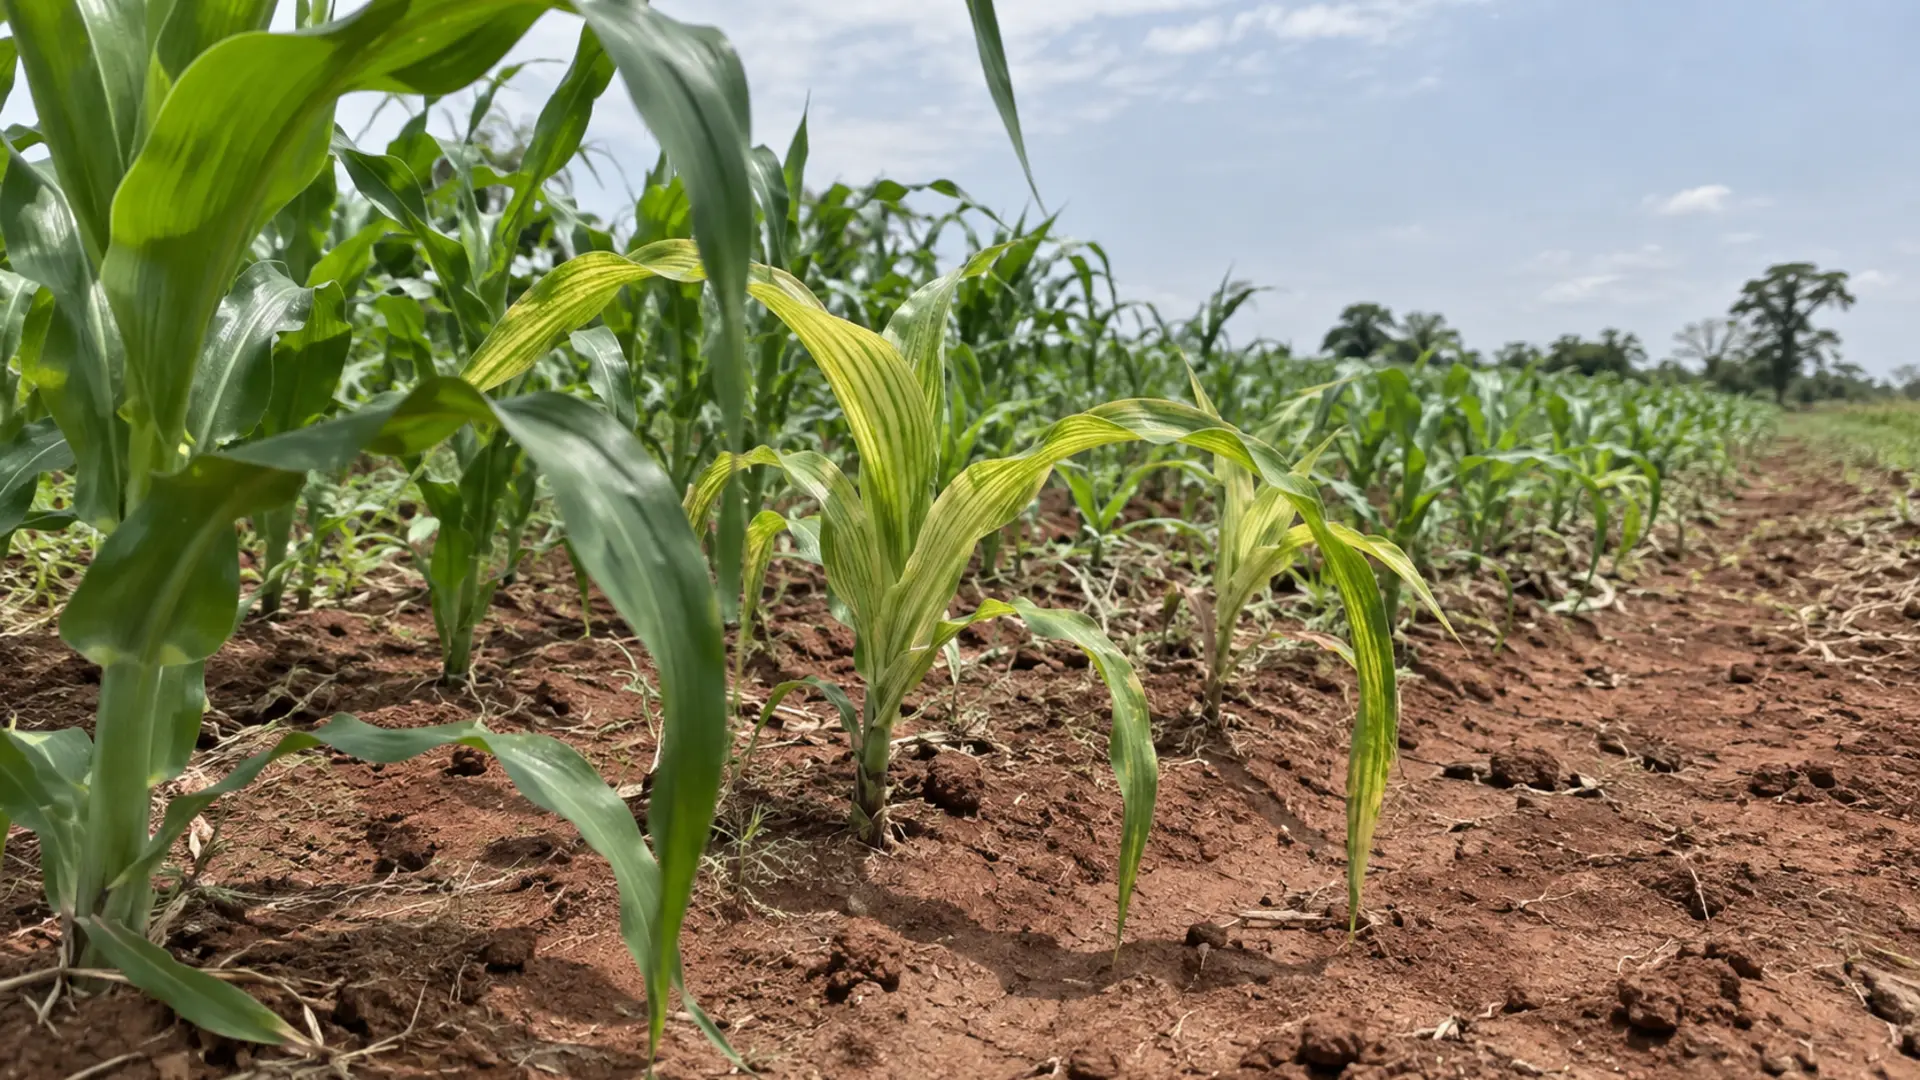
A farmer applies nitrogen, phosphorus and potassium, and the crop still looks wrong. The upper leaves are pale between the veins. The plants are short with their leaves bunched together. The vegetable heads are small and browning at the centre.
So more fertiliser goes on, or a fungicide, and neither works, because the problem was never nitrogen and was never a disease.
Micronutrients are needed in tiny quantities and almost nobody tests for them. They are also the nutrients whose deficiency symptoms most closely resemble disease and drought, which is why they are misdiagnosed more often than any other nutritional problem.
What this guide covers and what it excludes
It covers how to recognise micronutrient deficiency, how to tell it from disease and water stress, why a soil can hold a nutrient the crop cannot reach, how to confirm a suspicion by analysis, and how to test a correction on a strip before committing a field.
It excludes macronutrient management, whole soil report interpretation, and human nutrition claims of any kind.
And it excludes application rates, deliberately and completely. We will not give you a rate for zinc, boron or anything else. The reason is documented rather than cautious: an extension source on boron states plainly that “the range of boron deficiency and toxicity is very narrow and that the deficiency should be confirmed prior to boron application.” A rate that corrects a deficiency in one soil is a toxicity in another. Rates come from a soil analysis interpreted by somebody who has seen your report, not from an article.
The Ugandan context
The honest position is that Uganda has no national micronutrient deficiency map that we could find.
What exists is a peer-reviewed Ugandan study of staple crop mineral concentration which found that “variation in crop mineral concentration was high, particularly for Fe and Se”, and concluded that “extensive heterogeneity in staple crop mineral concentration in Uganda is likely due to a combination of edaphic characteristics and other variables.”
It found some relationship with soil: “soil pH was often positively associated with crop mineral concentration, while sand and organic carbon concentrations were negatively associated.” And it found an important limit to that relationship: “much of the variation in crop mineral content was not associated with the soil characteristics measured.”
Three practical conclusions follow, and they shape this entire guide.
Ugandan micronutrient status varies enormously over short distances. Your neighbour’s result does not predict yours.
No map will tell you what your field has. Anyone who tells you that a district is zinc deficient is generalising beyond the evidence.
Local confirmation is not optional. It is the only thing that distinguishes a correction from a guess, and given the documented narrowness of the boron margin, a guess is capable of doing harm.
The one rule that does most of the work
Before any of the individual symptoms, there is a single principle that narrows the field faster than anything else in this guide, and it is answered by looking at which leaves are affected.
Decision tree
Give the farmer the single diagnostic rule that resolves most micronutrient questions in the field, namely whether symptoms appear on old or new leaves, and route them from that observation to a shortlist.
Here is the principle that resolves most field diagnosis, and it is simpler than it sounds.
A nutrient that can move around inside a plant will be pulled out of the old leaves and sent to the new growth when supply runs short. So the old leaves show the damage first.
A nutrient that cannot move stays where it was put. When supply runs short, the new growth has nothing, and the old leaves look fine.
University extension guidance states both halves. “Mobile nutrients move to areas of active growth within the plant… Deficiency symptoms appear first in older leaves.” And: “Immobile nutrients do not redistribute within the plant… Deficiency symptoms show up in the new growth first.”
Then it lists which micronutrients fall into the immobile group: “Zinc (Zn), Boron (B), Iron (Fe), Manganese (Mn), Copper (Cu), and Molybdenum (Mo).”
All six. Every micronutrient in this guide is documented as immobile.
So the first question in the field is always the same. Where are the symptoms? If they are on the newest leaves or at the growing point, micronutrients are on the list. If they are on the oldest leaves, look first at nitrogen, magnesium and potassium, which are the mobile ones.
Two honest complications.
Zinc in flooded rice does not follow the rule. An extension service in a rice-growing region describes zinc deficiency in rice as “yellowing (chlorosis) of older leaves from the base of the leaf to the leaf tip”, progressing to “reddish-brown, irregular blotches”. That is an old-leaf picture for a nutrient classified as immobile. We report it rather than smoothing it over, because a Ugandan rice grower needs the rice picture and not the general rule.
Molybdenum is described differently by different sources. The extension source above classes it immobile. A state agriculture department factsheet describes molybdenum deficiency as worst in “older leaves”. These two credible sources disagree, we could not resolve it, and a reader should treat molybdenum as the one micronutrient where the leaf age rule is not dependable.
Chlorine. We searched for its mobility classification and could not verify one from a source we could open. This guide therefore says nothing about chlorine.
What each deficiency looks like
Six nutrients, six pictures. They are set out together below because in the field you are matching what you see against a list rather than reading about one nutrient at a time.
Diagnostic panel
Set the documented symptom picture for each micronutrient side by side so a farmer can match what they are looking at rather than reading six separate descriptions.
Zinc, in maize. Extension guidance describes it precisely: “Zinc deficiency in corn begins as an interveinal chlorosis usually during the 4 to 6 leaf stage.” And the feature that makes it recognisable at a distance: “Plants have very short internodes giving leaves the appearance of being stacked on top of one another.”
That stacked appearance is the giveaway. A maize plant that is short because it is zinc deficient looks compressed rather than simply small.
Zinc, in rice. As above, yellowing of older leaves from base to tip, progressing to reddish-brown blotches. Timing: “Zinc deficiency generally occurs between the 2-leaf and mid-tillering stages in rice.” Two aggravating conditions are documented: soils that are “alkaline and have a pH of 7 or above”, and the fact that “the establishment of the flood aggravates zinc deficiency.”
Boron, in brassicas. Extension guidance: “Cabbage heads may be small and yellow, while other cole crops can develop cracked petioles, stems, and midribs.” And: “Cauliflower curds may be stunted or turn brown, and leaves may roll and curl.”
A correction worth making, because the belief is widespread. Hollow stem in brassicas is routinely attributed to boron deficiency. The extension source we opened states the opposite: “Boron applications are not recommended to prevent hollow stem in the field.” We report that directly, because a farmer applying boron to prevent hollow stem is, on this source, applying it for a reason the source does not support, and boron is the nutrient with the narrow safety margin.
Boron, in sunflower. Extension guidance describes: “Stems may snap off just below head.” Also, “Leaves progressively become smaller, and upper leaves become puckered and deformed”, that “B-deficient plants are initially darker green and stunted”, and that “Buds may abort, or heads will display hypertrophy… resulting in poor and uneven seed set.”
Note that this source describes stems snapping, not hollow stems. We could not verify hollow stem terminology for sunflower and this guide does not use it.
Iron. “Iron deficiency chlorosis shows up in new leaf tissue as an interveinal yellowing to whitening while the veins remain green”, advancing so that “leaf tissue and even the growing point can die.” Cause: “caused when the soil pH is high. The higher the soil pH gets the more insoluble iron becomes.”
Manganese. “Deficiency symptoms first appear in younger plant tissues” as “interveinal chlorosis… in the young leaves while the veins remain dark green.”
And the detail that separates manganese from iron, which the same source supplies because the two “can often be confused”: “green veins with Mn deficiency are often wider than with Fe deficiency and have a fishbone appearance.”
Copper. In wheat, a “general light green to yellow color… leaf tips die back” with “purplish brown patches”. In maize, “new leaves as they come out of the whorl and develop a bluish green tint… may emerge from the whorl as spiraled.” In vegetables, the “growing point is stunted and eventually dies.”
Molybdenum. “pale green or yellowish green colour between the veins and along the edges”, advancing so that “the leaf tissue at the margins of the leaves dies”, producing “narrow, distorted leaves” described as whiptail. And a crucial point for a Ugandan bean or groundnut grower: in legumes the symptoms are “identical with nitrogen deficiency”, because molybdenum is required for nitrogen fixation.
A legume that looks nitrogen starved on an acid soil may be molybdenum starved, and adding nitrogen fertiliser will mask the cause without fixing it.
Is it a deficiency at all
This is where the most money is wasted, because a deficiency treated as a disease gets a fungicide and a disease treated as a deficiency gets a foliar feed. Neither works.
Comparison matrix
Separate micronutrient deficiency from disease and from water stress using features a farmer can observe without any equipment, because the commonest error is treating a deficiency as a disease.
This is where most money is wasted, because a deficiency treated as a disease gets a fungicide and a disease treated as a deficiency gets a foliar feed.
Extension guidance gives a workable rule: “Symptoms that occur suddenly and do not progress, or are across several plant species, are typical of abiotic disorders. Symptoms that develop progressively, are not uniformly distributed on the plant, and affect only one or a few related plant species are typical of biotic factors.”
A second extension source adds the field-scale version: “abiotic disorders often affect many plant species at a time”, including weeds, whereas “pathogens and pests have limited host ranges”, and abiotic damage appears “uniform along a pass, in a clearly defined area, or an entire field” against biotic spread that is “random, irregular”.
Four observations you can make in ten minutes.
Look at the weeds. A soil-related cause does not respect the difference between your crop and the weeds growing in it. A pathogen usually does. This is the fastest single test available and it costs nothing.
Look at the boundary of the affected area. Does it follow a soil change, a slope position, a former path or the edge of where something was applied? Or does it wander?
Look for signs, not just symptoms. A symptom is what the plant does. A sign is the organism itself: fruiting bodies, mycelium, insects, eggs. Extension guidance treats the presence of signs as the mark of a biotic cause. No signs, and a pattern following the soil, points the other way.
Look at which leaves. Back to the mobility rule.
What this cannot settle. It narrows. It does not confirm. Confirmation is analysis, and the next section covers it. The scouting discipline that produces the observations in the first place is in integrated pest management scouting and thresholds.
Why a soil can contain a nutrient the crop cannot get
This is the concept that makes the whole subject make sense, and it explains why adding more of a nutrient can achieve nothing at all.
Process diagram
Explain why a soil can contain a nutrient the crop cannot obtain, which is the concept that makes the whole subject make sense and the one that prevents pointless applications.
This is the concept that makes the subject coherent, and it also explains why applying more of a nutrient can be entirely pointless.
Micronutrients exist in soil in chemical forms of varying solubility. Whether a root can take them up depends heavily on soil pH.
Extension guidance states the general rule: “All the known micronutrients… decrease in availability as pH rises, except for molybdenum (Mo).”
And it gives the rate, which is startling: “Zinc (Zn), Cu and Mn decrease 100 fold in concentration with every one unit increase in pH.”
A hundredfold, per pH unit. That is why a soil at pH 7.5 can contain the same total zinc as a soil at pH 6.5 and deliver almost none of it.
The individual thresholds, each from the extension publication for that nutrient:
Zinc “becomes much less available as the soil pH increases. This usually occurs at pH> 7.4 (calcareous soils) but may happen at a pH as low as 6.5.”
Manganese deficiency “is likely to occur on heavily weathered sandy soils and peat or organic soils with a pH above 6.0. On mineral soils such as calcareous soil, Mn deficiency may occur with pH values of 6.5 or above.”
Copper deficiency is documented as occurring “in peaty soils with high concentrations of organic matter”, with “sandy-textured soils” more likely to be deficient, and “soils with a pH of 7.5 or greater should be monitored.”
Iron becomes progressively more insoluble as pH rises.
Molybdenum runs the other way. “Molybdenum in acid soils tends to be unavailable to plants… most occur where pH is 5.5 or less.”
And one further marker that matters greatly in Uganda, where acid soils are common: “When soil pH drops below 5.5, Al becomes soluble and is toxic to plant roots.”
The practical consequence. Correcting pH may correct the deficiency without applying the nutrient at all. On an acid soil showing molybdenum symptoms, liming raises availability. On an alkaline soil showing zinc symptoms, adding more zinc to a soil that already has zinc in an unavailable form may achieve nothing. The pH question comes before the nutrient question, and it is covered in soil acidity and liming.
Confirming it
Two analyses exist and they are not equivalent.
Extension guidance from a grains research body is blunt about which is better: “Plant tissue testing is a more reliable method than soil testing for diagnosing and monitoring micronutrient status.” And it explains why soil testing is weak here: “In general, soil tests have a low reliability in predicting micronutrient deficiencies because the elements are present in such low quantities.”
Documented critical levels, with their extractants named.
For zinc: “Critical level for DTPA Zn soil test: <0.2 to at least 0.4mg/kg… A tissue test result of <10mg/kg indicates Zn deficiency.”
For boron: “Critical level for hot water soluble (HWS) B soil test: <0.5mg/kg… Tissue test results below 2 to 4mg/kg are marginal, values greater than 5 to 10mg/kg indicate B adequacy.”
Those extractant names matter. If you ask a laboratory for zinc, ask whether they run the DTPA extraction, because a total zinc figure and an extractable zinc figure are different numbers answering different questions.
Sufficiency ranges vary. Different sources give different sufficiency ranges for different crops, different tissues and different laboratories. This guide gives the figures above as documented critical levels and does not present them as universal. Your laboratory’s own interpretation, for your crop, is what applies.
Tissue sampling has a protocol and it must be followed. For maize, extension guidance specifies “15-20 ear leaves, or first leaf below and opposite the ear should be collected at random from the field at silk emergence.” For diagnostic sampling on younger plants: “if plants are less than 12 inches tall, collect the whole plant, cut off at ground level. If above 12 inches, and until reproductive growth begins, collect the top fully developed leaves.” Handling: samples should be “allowed to wilt over night to remove excess moisture, placed in a paper bag or mailing envelope.”
Note the paper bag. A plastic bag sweats and the sample rots before it arrives.
And a rule worth following whatever the crop. Take a matched sample from healthy plants nearby as well as from affected ones. A laboratory result from affected plants alone tells you the concentration. A pair tells you the difference, which is the thing you actually want to know.
The wider approach to soil analysis is in soil testing and fertility.
Testing a correction before you commit a field
Even with a confirmed deficiency, a strip trial comes before a field application. The documented narrowness of the boron margin is the reason.
Step sequence
Give a repeatable on-farm strip trial method so that a farmer tests a correction on a small area before committing a field, which is the only safe response given the documented narrowness of the boron margin.
Even with a confirmed deficiency, the sensible next step is a strip trial rather than a field application. The reason is the boron margin, and it applies with less force but real force to the others.
Extension guidance on on-farm experimental design supplies the method. On layout: “Long, narrow plots often work well. The plot width is determined by equipment widths.”
On the control, which is the step people omit: “A control allows you to make a direct comparison between the old practice and the new one. Treat your control exactly like the other treatment plots, except for the difference or differences you are testing.”
On replication: “Four replicates are a good place to start”, with the note that repeating a trial across years can substitute for spatial replicates.
Five rules that make a strip trial worth running.
Confirm before you trial. A trial of a correction for a deficiency you do not have wastes a season.
Include untreated strips. Without them you have a yield figure with nothing to compare it against.
Change one thing. If you apply a micronutrient and change the variety in the same trial, you learn nothing about either.
Choose a uniform area. Headlands, slopes and old boundaries carry their own differences and will swamp the effect you are looking for.
Harvest and weigh each strip separately. An impression of which strip looked better is not a result.
The approach to reading any agricultural result critically, including your own, is in reading agricultural research for a Ugandan farm.
Common mistakes and why they fail
Adding nitrogen to a pale crop. Pale between the veins on new leaves is not nitrogen. Nitrogen deficiency is a general yellowing of old leaves.
Applying a micronutrient without confirming the deficiency. The boron margin is documented as very narrow and the source explicitly says to confirm first.
Applying a nutrient to a soil where pH is the constraint. A hundredfold availability change per pH unit means pH often matters more than quantity.
Spraying a fungicide at a deficiency. No effect, and the cost recurs because the symptom recurs.
Using a district-level generalisation. The Ugandan study found heterogeneity that soil characteristics themselves largely failed to explain.
Applying boron to prevent hollow stem in brassicas. The extension source we opened states this is not recommended.
Sending tissue samples in a plastic bag. They arrive spoiled.
Sampling only the bad plants. A paired sample is worth several times an unpaired one.
Treating a legume that looks nitrogen deficient with nitrogen, on an acid soil. It may be molybdenum, and adding nitrogen hides the cause.
Assuming the fertiliser you bought contains what the label says. Verification of inputs is a separate discipline and it is covered in fertiliser types and quality verification.
Cautions and escalation points
Toxicity is real and boron is the clearest case. The documented toxicity picture is “wrinkling of the lower leaves and interveinal chlorosis along the leaf margin”, progressing to “chlorosis and necrosis”. Because the margin is narrow, an over-application is capable of damaging a crop that was merely underperforming.
Numbers vary by source, crop, soil and laboratory. Different sources give different deficiency and toxicity thresholds. This guide gives the qualitative conclusion, that the margin is narrow, rather than presenting any single number as universal.
Escalate to a soil laboratory before any micronutrient application, and ask specifically which extraction method they use.
Escalate to a qualified agronomist for the rate. This guide gives none and will not.
Escalate to a plant clinic or diagnostic service if the comparison matrix points toward a biotic cause or if you cannot separate the two.
Do not extrapolate to human nutrition. Crop mineral concentration and human dietary status are different subjects and this guide makes no claim about the second.
Practical action plan
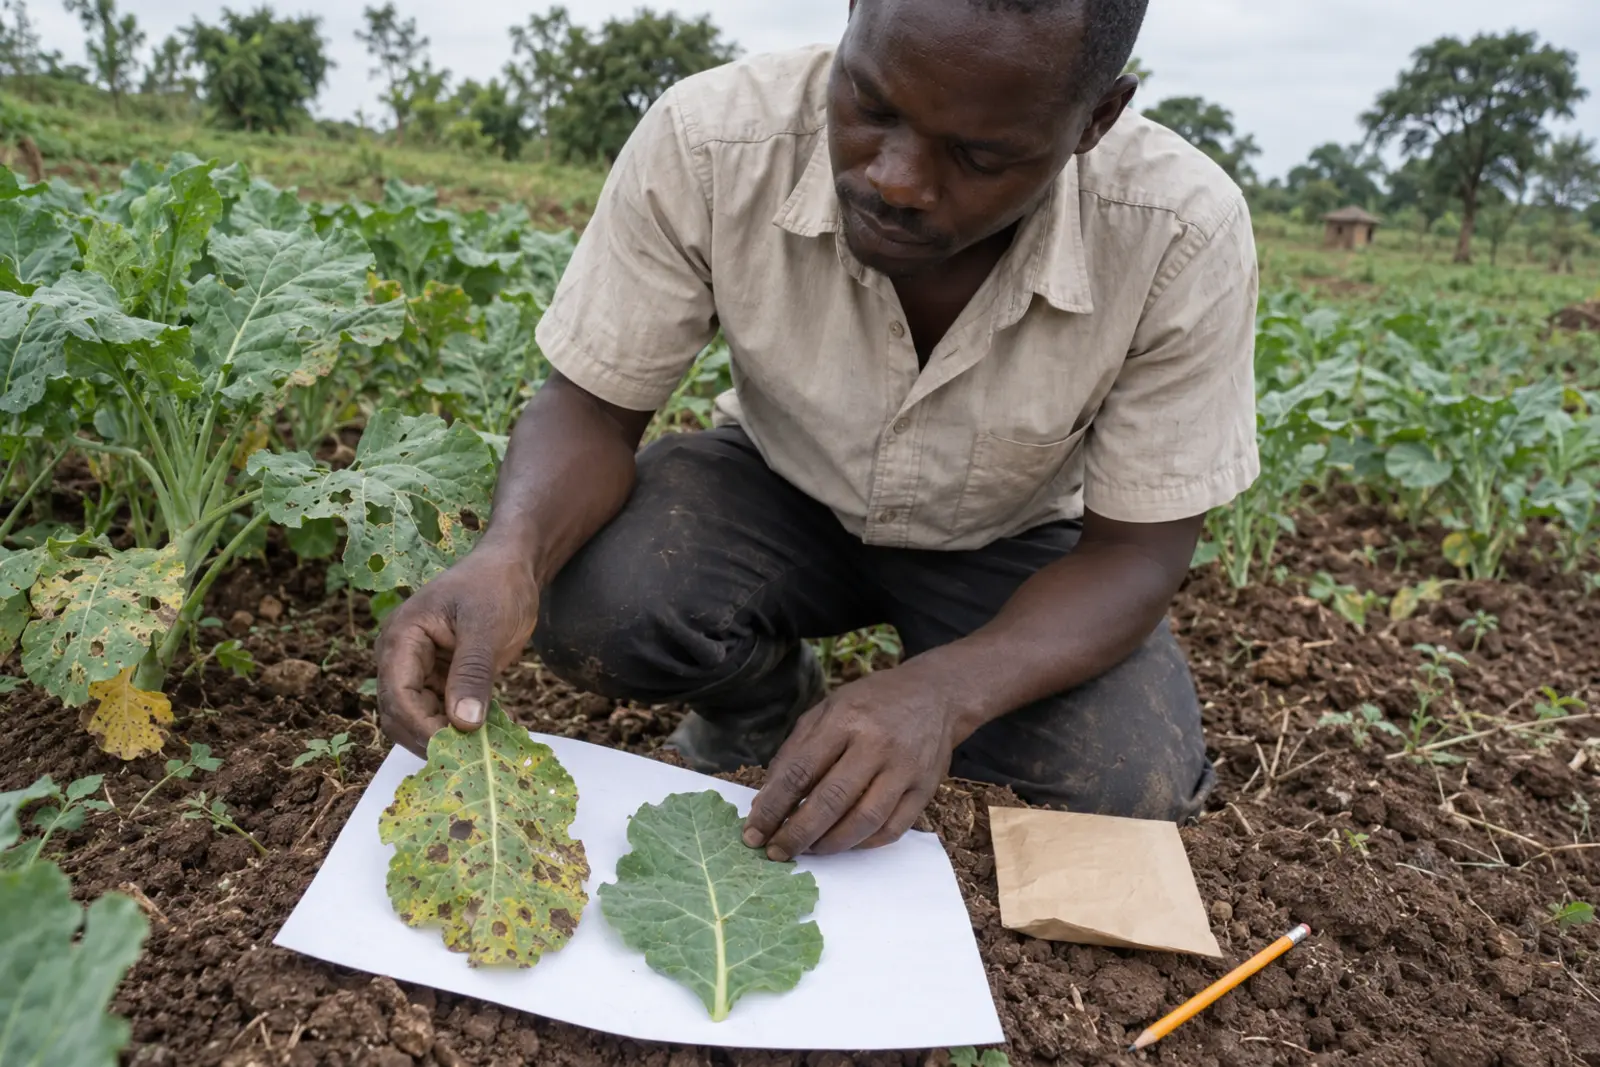
This week. Walk the affected area. Record which leaves are affected, what the pattern is, whether the weeds are affected, and whether the boundary follows anything in the soil. Photograph an affected leaf next to a healthy one on a plain background.
This week, also. Cross-check against the diagnostic table and the comparison matrix. If the picture points biotic, stop here and take it to a diagnostic service.
Within the month. Take a soil sample and, if the crop is at a suitable stage, a paired tissue sample from affected and healthy plants. Use paper, not plastic. Ask the laboratory which extraction they run.
When the result comes back. Take it to an agronomist with the field history. Ask two questions before any nutrient question: what is the pH, and does correcting it change the availability picture. The general pH decision is covered in soil acidity and liming.
Before any field-scale application. Run the strip trial. Untreated strips, four replicates if you can, one variable, separate harvest weights.
Across seasons. Keep the records. Which block, which crop, which symptom, which result, which season. Micronutrient problems recur in the same places because the soil does not move, and a two-season record of your own field is worth more than any published map, particularly in a country that does not have one. The record keeping framework is in farm record keeping and gross margin analysis.
Conclusion
Micronutrient deficiency is not hard to recognise once you know the rule. Look at where the symptoms are: new growth points at micronutrients, old growth points elsewhere. Look at whether the weeds are affected: they usually are if the cause is in the soil.
What is hard is the correction, and that is because the quantities involved are tiny and the margin between too little and too much is documented as narrow.
So this guide ends where an honest guide has to end. Diagnose in the field, confirm in a laboratory, correct the pH question first, and test on a strip before you commit a field. The one thing not to do is buy a micronutrient product because a crop looked wrong.
Author
This guide was produced by the Falcon Foundation Ltd Editorial Team. We research agricultural questions against published institutional guidance, extension publications and peer-reviewed evidence, and we translate them into decisions a Ugandan farmer can act on. Where sources disagree, we report both positions rather than choosing between them. This article gives no application rate for any micronutrient, because the documented margin between deficiency and toxicity is narrow and a rate depends on a soil analysis interpreted by a qualified agronomist.