
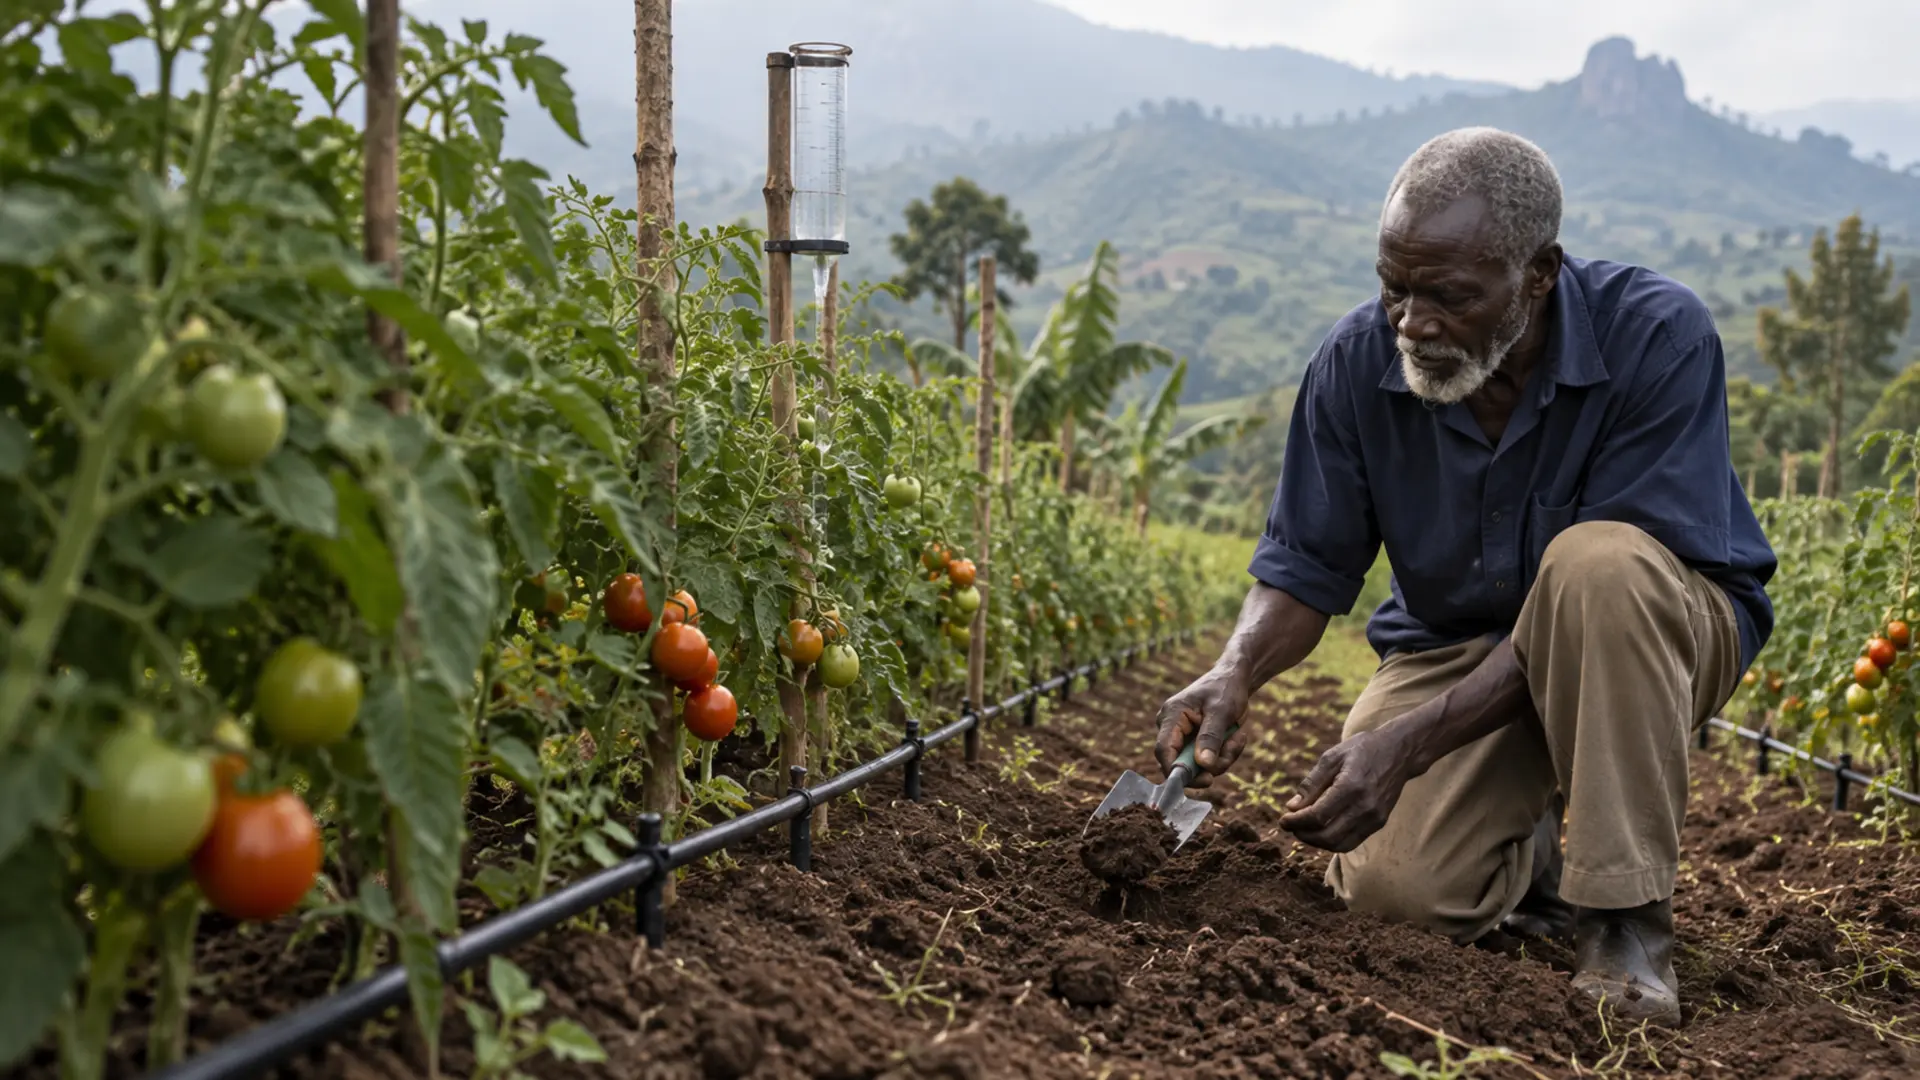
Ask a grower with a new system how often they irrigate and the answer is very often a time rather than a condition. Every morning. Two hours in the evening. Every second day.
That is a habit, and a habit is not a schedule. It has no way of knowing that it rained overnight, that the crop is at a stage where it needs very little, that the soil is a heavy clay that will hold water for a week, or that the plants are three weeks from harvest and being pushed into disease by water they do not need.
The cost is not only wasted water and pumping. Repeated shallow irrigation can concentrate roots near the surface and leave a crop more vulnerable when supply fails. Excess water can also increase disease pressure or move nutrients below the active root zone. The correct interval depends on crop stage, soil, weather and effective root depth, not on a fixed daily habit.
This guide replaces the habit with a method. It is deliberately built around a test you can do with your hands, because a moisture meter you do not own is not a method.
What this guide helps you decide
When to irrigate, from an observation rather than a clock. How much to apply once you have decided to. Which growth stages matter most, so you know where to put water when there is not enough of it. And what to write down, so that next season you are not starting again.
The short answer
Dig at root depth, feel the soil, and decide from what it does in your hand. Apply enough to refill the root zone and no more. Give priority to the crop at flowering and yield formation. And write down, for every application, what the soil did that made you turn the water on.
The three ideas you need first
Irrigation scheduling rests on three concepts, and they are worth understanding rather than memorising.
Field capacity and wilting point. The Food and Agriculture Organization’s guidance on crop evapotranspiration defines field capacity as the amount of water remaining when downward drainage has markedly decreased, and permanent wilting point as the water content at which plants will permanently wilt. Between those two lies all the water your crop can use.
Total and readily available water. The same source defines total available water as the difference between water content at field capacity and at wilting point, which is the amount of water a crop can extract from its root zone, and readily available water as the fraction of that which a crop can extract without suffering water stress. The formulae are simple: total available water equals 1,000 times the difference between the two water contents, multiplied by the rooting depth in metres; readily available water is that total multiplied by a depletion fraction.
The depletion fraction. This is the proportion of the total you are willing to let the crop use before you irrigate. The same guidance tabulates it by crop, giving values such as 0.30 for dry onion, 0.35 for potato, 0.40 for tomato, 0.45 for cabbage and dry beans, 0.50 for cucumber and 0.55 for grain maize.
Together these say something useful: a shallow-rooted crop like onion, on a light soil, has very little readily available water and must be irrigated often and lightly, while maize on a deep loam has a large reservoir and should be irrigated less often and more heavily.
The soil check, which is the heart of the method
Two published sources give the same field method for estimating soil moisture by feel and appearance, one from the United States soil conservation service and one produced under a global soil partnership field programme. They agree closely, and their descriptions are the practical core of this article.
On a coarse-textured soil, at the driest band the soil is dry and loose, will hold together if not disturbed, with loose sand grains coming off on the fingers. In the moist band, it forms a weak ball with loose and aggregated sand grains on the fingers.
On a medium-textured soil, at the driest band the soil is dry, aggregations break away easily, there is no staining on the fingers and clods crumble. In the moist band, it forms a ball, with very light staining on the fingers, and forms a weak ribbon.
On a fine-textured soil, at the driest band the soil is dry, aggregations separate easily and clods are hard to crumble. In the moist band, it forms a smooth ball with defined finger marks and ribbons between thumb and forefinger.
The field programme sheet adds the interpretation bands directly: below about half of available water, plants may be experiencing water deficit stress; between about half and three quarters is moist; above that is wet; and beyond field capacity plants may be experiencing waterlogging.
Irrigation Scheduling: Deciding When to Irrigate and How Much, Instead of Watering Daily
Soil feel and appearance chart across coarse, medium and fine textured soils at four moisture levels, with the irrigate or wait decision for each
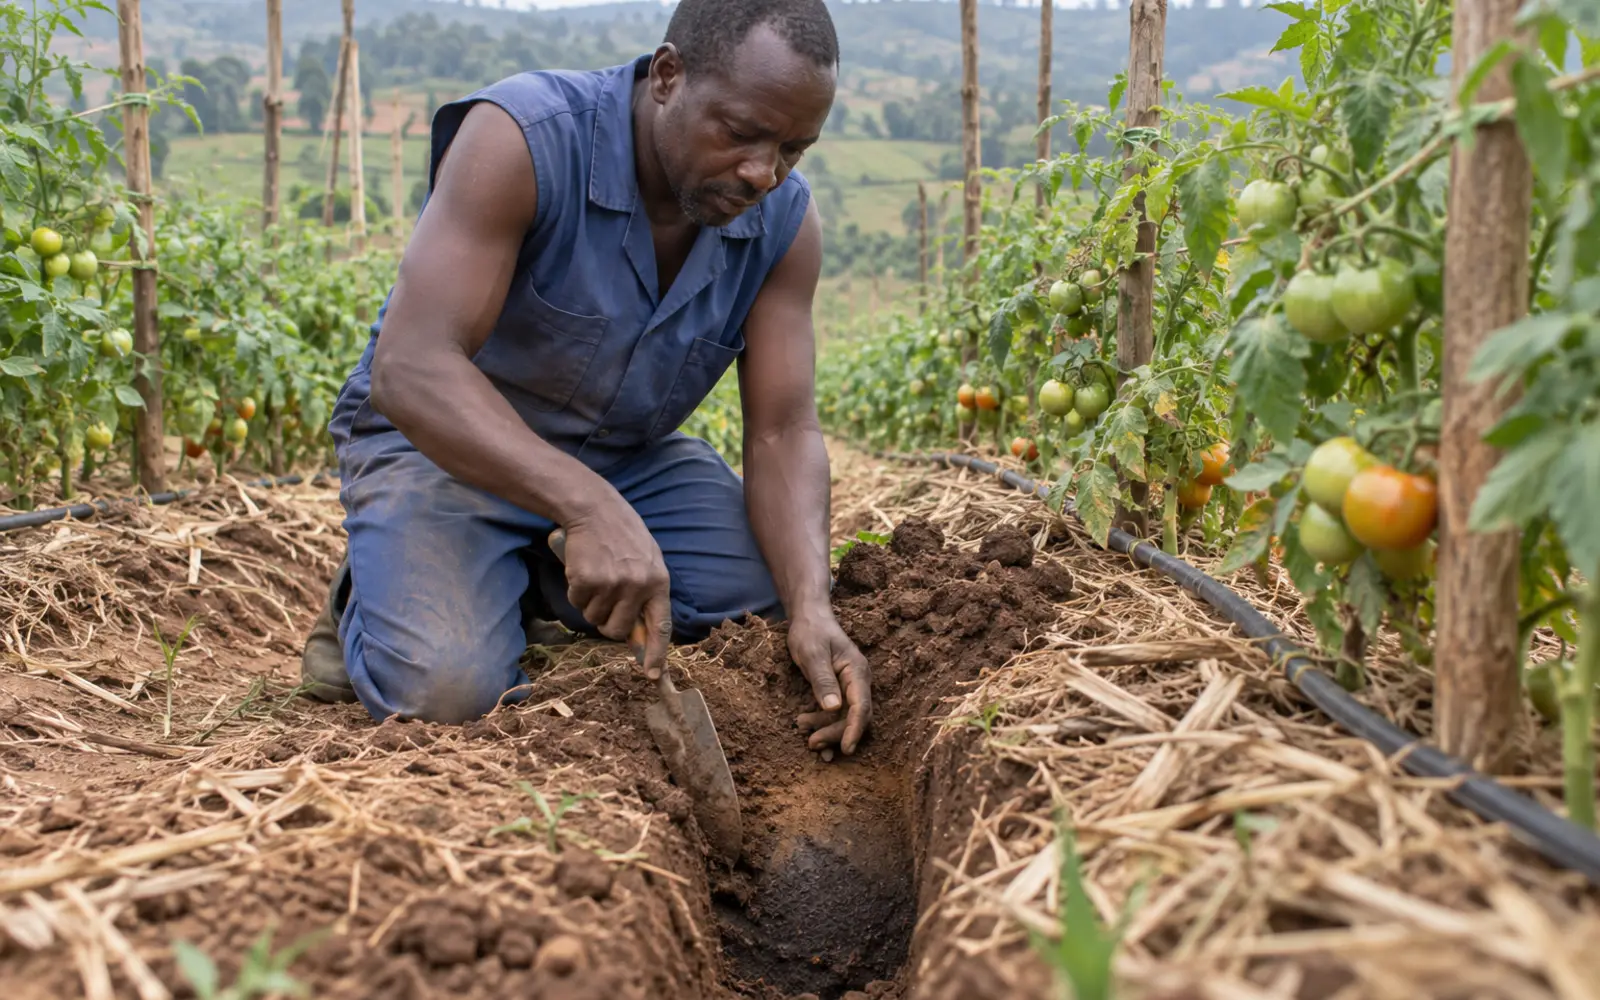
Where to take the sample. This is the part that gets done wrong. Not from the surface, which dries first and tells you about the weather rather than the crop. Take it from the middle of the root zone, which for most vegetables means somewhere between fifteen and forty centimetres depending on the crop and its stage. Dig a small hole with a trowel, or use an auger if you have one, and take the sample from the side of the hole at depth.
Where in the field. Take at least three checks, in places that represent your field rather than flatter it: one in the driest-looking part, one typical, one at the end of the line furthest from the pump if you irrigate in runs.
What you are comparing against. The feel test tells you roughly what fraction of the available water is left, not an absolute figure. That is enough, because the decision is a threshold decision: are you above or below the depletion fraction for this crop at this stage. Two checks a week, in the same places, will teach you your own soil faster than any table.
How deep are the roots
Rooting depth is what converts soil moisture into a quantity of water. Two published sets are useful.
The Food and Agriculture Organization’s crop evapotranspiration guidance gives per-crop rooting depth ranges: onion, dry, 0.3 to 0.6 metres; potato 0.4 to 0.6; cabbage 0.5 to 0.8; dry beans 0.6 to 0.9; cucumber 0.7 to 1.2; tomato 0.7 to 1.5; grain maize 1.0 to 1.7.
Its irrigation water management training manual gives simpler classes: shallow rooting crops at 30 to 60 centimetres, including brassicas such as cabbage and cauliflower, celery, lettuce, onions, pineapple, potatoes and spinach; medium rooting crops at 50 to 100 centimetres, including bananas, beans, beets and carrots; and deep rooting crops at 90 to 150 centimetres, including alfalfa, barley, citrus, cotton and dates.
Use the class system to start and the crop-specific range once you are comfortable. And remember that a young crop has a fraction of its final root depth, which is why early irrigations should be shallower and more frequent than later ones.
How much to apply
You need a depth, in millimetres, and then a running time.
The training manual gives a table of net irrigation depths by soil type and root-depth class that is usable directly: on a sandy soil, 15 millimetres for shallow-rooted crops, 30 for medium and 40 for deep; on a loamy soil, 20, 40 and 60; on a clayey soil, 30, 50 and 70.
It also works an example. For groundnuts on a loamy soil, a net depth of 40 millimetres becomes a gross depth of 65 to 67 millimetres at 60 per cent field application efficiency, applied every 7 to 10 days depending on whether the crop is in its peak period. That gap between net and gross is the water that never reaches the root zone, and ignoring it is one reason growers under-apply while believing they have over-applied.
Converting depth to volume. One millimetre of water over one square metre is one litre. That is arithmetic rather than a published finding, but it is the conversion you will use constantly: a 30 millimetre application over a 100 square metre bed is 3,000 litres.
Converting to a flow rate. The training manual gives the conversion for continuous supply: 8.64 millimetres per day equals 1.0 litre per second per hectare.
Converting to a running time. Measure your system’s output rather than trusting the specification. For drip, put a container under a sample of emitters for a measured time and work out litres per hour per emitter, then multiply by emitters per square metre. For a sprinkler, set out several straight-sided tins across the wetted area, run the system for a fixed time, and measure the depth collected in each; that also tells you how evenly the system applies, which is often the more valuable finding.
Once you know your system applies, say, 8 millimetres per hour, then a 32 millimetre gross application is a four-hour run. Write that on the pump house wall.
Which stages matter most
When water is short, the question is not only how much but where to put it.
The training manual is unambiguous: the mid-season stage is most sensitive to water shortages and is the period of highest crop water needs, the late season stage is the least sensitive, and if water is in short supply it is advisable to give priority to irrigating those fields on which the crop has reached the mid-season stage, meaning flowering and yield formation.
It also ranks crops by sensitivity, stating that crops grown for their fresh leaves or fruits are more sensitive to water shortages than those grown for their dry seeds or fruits, listing banana, fresh green vegetables, paddy rice, potato and sugarcane among the most sensitive, and noting that millet and sorghum are only slightly sensitive to drought and are drought resistant.
The quantitative version comes from the Food and Agriculture Organization’s work on crop yield response to water, which states that flowering and yield formation stages are sensitive to stress while stress during ripening has limited impact, and gives yield response factors for maize by stage of 0.2 at vegetative, 0.9 at flowering, 1.5 at yield formation and 0.5 at ripening, alongside seasonal factors including maize 1.25, beans 1.15, banana 1.2 to 1.35, cotton 0.85 and groundnuts 0.70.
Irrigation Scheduling: Deciding When to Irrigate and How Much, Instead of Watering Daily
Crop stage sensitivity strip showing the four growth stages with the relative sensitivity to water shortage at each and the priority rule when water is short
A note on crop water requirement figures
You will see figures quoted in millimetres per day for particular crops. Handle them carefully.
The standard framework calculates crop evapotranspiration as a crop coefficient multiplied by a reference evapotranspiration, with the crop coefficient varying across four growth stages: the initial stage from planting to about 10 per cent ground cover; crop development from 10 per cent ground cover to effective full cover; mid-season from effective full cover to the start of maturity, when the coefficient reaches its maximum and stays relatively constant; and late season from the start of maturity to harvest or full senescence.
The published coefficient values, for example 1.15 at mid-season for tomato and potato, 1.05 for cabbage and dry onion and 1.20 for grain maize, come with a stated reference condition attached: non-stressed, well-managed crops in subhumid climates with minimum relative humidity around 45 per cent and wind speed around 2 metres per second. Uganda’s climate is not that reference climate everywhere, and the guidance itself provides a procedure for adjusting the values, which we did not independently verify and therefore do not reproduce.
The practical consequence: any millimetres-per-day figure quoted to you without a named source and its reference conditions should be treated as decoration. This article gives you a soil-based method precisely because it does not require you to trust such a figure.
What over-irrigation actually does
The daily habit has consequences that are worth stating, because they are not obvious from the surface.
Extension guidance on wet soil conditions from over-irrigation and flooding states that when soil is too wet or waterlogged the oxygen content is reduced and minimal oxygen is absorbed by the plant roots; that over-irrigation leads to water loss, increases energy use for pumping, causes leaching of nitrogen and other micronutrients and wastes time; that it can increase the potential of crop yield losses from fungal and bacterial foliar and root rotting diseases; and that nitrogen is also lost through bacterial denitrification. A field trial reported in that guidance recorded yield reductions of 6 per cent in one season and 4.3 per cent in the next from a treatment irrigated to 125 per cent of crop evapotranspiration. That trial was on maize in the United States and is cited here for the mechanism, not as a Ugandan figure.
Shallow rooting is the fifth consequence and the one growers notice last. It is also the one that turns a pump breakdown into a crop failure.
Uganda, and where the equipment came from
Many Ugandan growers now have equipment through the national micro-scale irrigation programme, and it is worth knowing what that programme is.
The Ministry of Agriculture, Animal Industry and Fisheries describes it as supporting farmers to purchase individual irrigation equipment through a matching grant scheme in which the cost is co-financed by the farmer and the government, with government paying between 25 and 75 per cent of the total cost up to a maximum contribution of 7.2 million shillings per acre, capped at 2.5 acres or one hectare. It is led by the Ministry’s Department of Agricultural Infrastructure, Mechanization and Water for Agricultural Production and supported by the World Bank through the Uganda Intergovernmental Fiscal Transfer Program, and participants are described as receiving complementary services such as extension support in irrigated agriculture.
Reporting on an Auditor General’s review raises a point directly relevant to this article. One outlet reported that only 147 out of 344 beneficiary farmers had received training before acquiring the irrigation equipment; another reported that only 42 per cent of interviewed beneficiaries had received training and that 70 per cent of those who had not attended training faced challenges with the functionality and usage of their systems. The two reports give slightly different figures for what appears to be the same review, so we present both with their sources rather than picking one.
We looked specifically for Ugandan farm-media reporting of a named farm irrigating on a fixed daily schedule with poor results, because that would be a useful illustration. We did not find one we could verify, and we are not going to construct an anecdote to fill the gap.
For rainfall, the Uganda National Meteorological Authority publishes dekadal and seasonal products through its Climate and Data section and operates an observation network. We were unable to open the pages that would let us describe the network or the length of record, so we direct you to the authority’s own site rather than characterising what you will find there.
The log sheet
An irrigation record that lists only dates and hours is not much use. The one that changes behaviour has a column for the observation.
For each application, write: the date; the crop and its growth stage; where you took the soil check and at what depth; what the soil did in your hand; the decision; the depth applied in millimetres; the running time; and any rainfall since the last entry.
The fourth column is the discipline. If you find yourself writing entries with that column blank, you have gone back to a habit.
Irrigation Scheduling: Deciding When to Irrigate and How Much, Instead of Watering Daily
Irrigation log sheet linking each application to the soil observation that triggered it, with columns for date, crop stage, soil check result, depth applied and rainfall
Cost categories
No prices. The relevant lines are: a hand trowel or a soil auger, which is the only new tool this method requires; straight-sided tins or a measuring container for calibrating your system’s output; a notebook or printed log sheets; the labour of checking, which is a few minutes per irrigation; a rain gauge, which pays for itself the first time it stops you irrigating after a shower you underestimated; energy or fuel for pumping, which this method reduces; and, if you decide to settle the soil question properly, a soil texture assessment.
Common mistakes
Sampling the surface instead of the root zone. Taking one sample and treating it as the field. Irrigating on the clock without a rain gauge. Applying the same depth all season regardless of how deep the roots have gone. Confusing net and gross application, and under-applying while believing the opposite. Using a crop water figure with no source and no reference conditions attached. Treating a wilted crop in the afternoon heat as evidence of drought when it recovers by evening. Irrigating heavily at ripening, when the crop is least sensitive and disease risk is highest. And never measuring what the system actually delivers per hour.
Warning signs and escalation points
In the crop: yellowing of lower leaves without a fertility explanation; roots concentrated in the top few centimetres when you dig; standing water or a sour smell in the root zone; root and collar rots appearing in the wettest part of the field.
In the system: emitters delivering visibly different amounts along a line; a tin test showing large differences across the wetted area; a pump running longer than it used to for the same effect.
Get help if the tin or emitter test shows large unevenness, because no scheduling method can correct a system that applies twice as much at one end as the other. That is a design or maintenance problem and it must be fixed before scheduling can do anything.
Where it works and where it does not
This method works on any system where you control the timing, which includes drip, sprinkler and controlled furrow. It works best on soils whose texture you know, and knowing it approximately is enough.
It works less well where the water supply itself dictates the schedule, for example where you can only irrigate on the days a scheme delivers water, or where a shared pump sets the rota. In that case the method still tells you how much to apply when your turn comes, which is still worth having.
A low-risk first step
Do two things this week, neither of which costs anything much.
Calibrate the system. Run it for a measured time and either collect from emitters or set out tins, and work out how many millimetres per hour it applies. Write that number where you will see it.
Then, on the next day you would normally irrigate, dig at root depth first and do the feel test before turning anything on. Write down what the soil did and what you decided.
Do that for two weeks and you will have replaced the habit with a method, without buying anything.
What to do next
Read small-scale irrigation in Uganda and drip, sprinkler and furrow irrigation if the method choice is still open, and pump selection and sizing and solar-powered irrigation for the supply side. On-farm water sources and water storage and farm ponds cover where the water comes from, and rainfall records and seasonal forecasts for farm planning is the companion to the rain gauge recommended here. Soil testing and fertility will tell you the texture this method depends on. Our forthcoming guides to water abstraction rules - scheduled in this programme and to greenhouse fertigation - scheduled in this programme extend this in two directions.
About the author
The Falcon Foundation Ltd Editorial Team produces evidence-based agricultural guidance for Ugandan farmers, drawing on published research and institutional sources and translating them into practical decision support. Where evidence is unavailable or contested, we say so rather than filling the gap.