
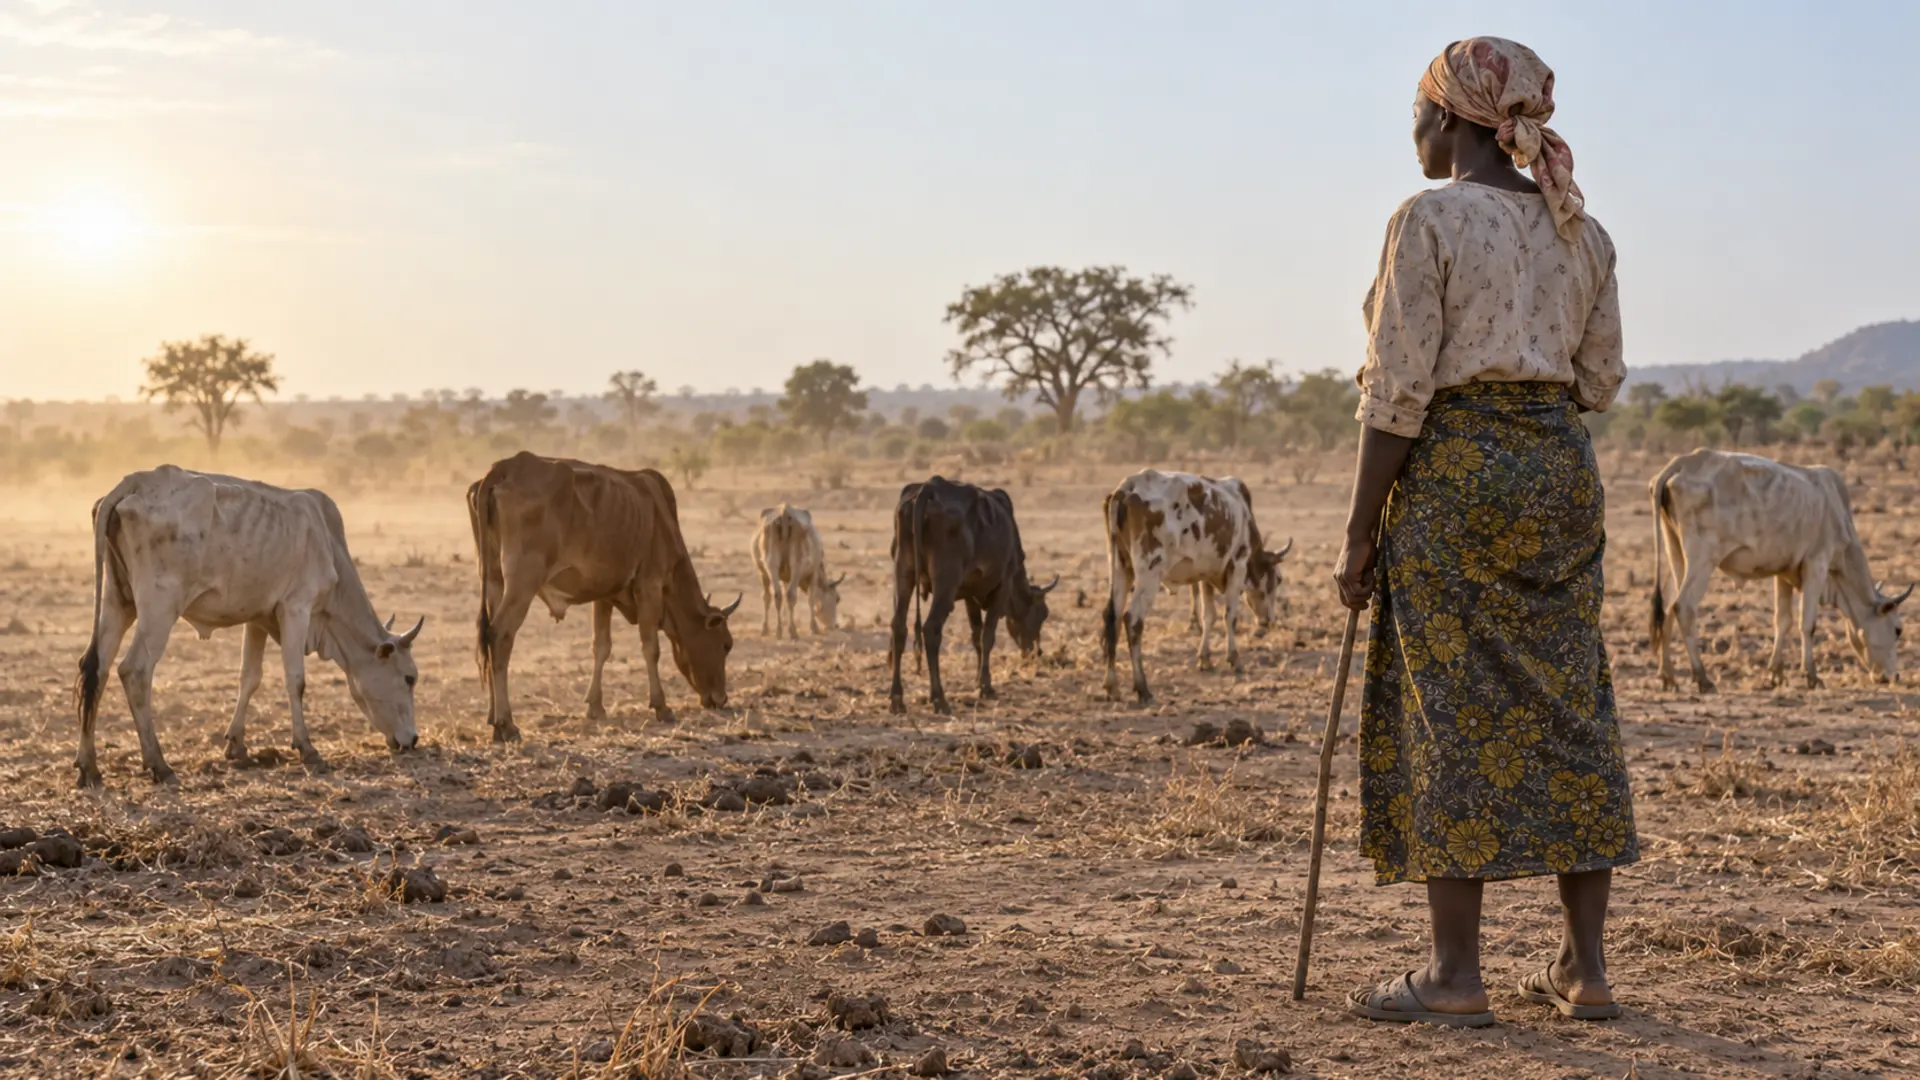
Ask a Ugandan livestock keeper when feed runs short and you will get an immediate, confident answer. Ask how short, and the conversation stops.
That gap between knowing which months are hard and knowing how hard is the whole subject of this guide. It matters because the two lead to completely different behaviour. A keeper who knows the season is difficult braces for it. A keeper who knows they will be four hundred kilograms of dry matter short in the second half of January has a problem they can solve in August, when there is still standing grass to conserve, land to plant and time to decide.
The evidence that this is a real and severe problem in Uganda is not in dispute. A study by the national research organisation’s Mbarara institute recorded that south-western Uganda annually experiences prolonged drought resulting in a dramatic drop in milk production, that the area experiences drought for at least 183 days a year, and that during such periods milk yield occasionally drops to zero, with some cattle dying of starvation and dehydration due to lack of forage and water. Work in northern Uganda measured what closing part of that gap is worth: cows receiving dry-season supplementation produced more milk per day than unsupplemented controls.
Those are the two ends of the same fact. The dry season takes production, and feed put in front of the animal takes some of it back. The calendar is how you decide what to put there, and when to prepare it.
What this guide does
It builds one worksheet. On the left are the months. Down the page are your herd’s requirement and your farm’s supply. Where supply falls below requirement, you have a deficit month, and the size of that gap drives the decision.
It does not cover how to make hay or silage, which is separate work, nor the agronomy of planted fodder. It does not cover feed costing, which is dealt with in diagnosing your farm feed cost. It assumes you have already listed what feed resources exist on your farm; if you have not, start with the farm feed resource inventory, because the calendar has nothing to plot without it.
The companion overview of the whole subject is year-round fodder planning for goats and cattle. This guide is the arithmetic underneath it.
Why a calendar rather than a rule of thumb
Feed planning fails in a specific and predictable way. The farm looks fine for eight or nine months, so nothing is prepared. Then the grass stops, and every possible response is now expensive, slow or both. Planting takes a season. Conserving requires surplus that no longer exists. Buying happens at the moment every other keeper in the district is also buying. Selling happens when every other keeper is also selling, which is the worst price of the year.
A calendar does not create feed. It moves the decision point to a month where the options are still open.
There is a real method behind this. The feed assessment tool developed for exactly this purpose describes itself as a systematic method to assess local feed resource availability and use, and its data structure asks users to enter overall feed availability by month and then break it down by feed source. That is the structure this guide adapts to a single farm: month by month, source by source.
Building a Twelve-Month Fodder Calendar for Your Own Farm
A blank twelve-month fodder calendar worksheet with a row for monthly herd requirement, rows for each feed source, a total supply row and a surplus or deficit row, all columns empty for the reader to complete.
Step one: fix the unit, and use it everywhere
Almost every fodder calendar that fails, fails here.
A keeper writes “two bags” under one month, “half the paddock” under another, and “a load of maize stover” under a third. None of those can be added together, so the total supply row is meaningless, so the deficit cannot be calculated, so the sheet becomes decoration.
Pick one unit and convert everything into it. The standard unit for this work is kilograms of dry matter, because it is the unit in which animal requirements are expressed and because it makes wet and dry feeds comparable. A fresh-cut bundle of Napier and a bale of hay of the same weight contain very different amounts of actual feed, and dry matter is what removes that confusion.
If kilograms of dry matter are genuinely beyond what you can estimate, the fallback is days of feeding for the whole herd, which is cruder but still additive. What you cannot do is mix units.
Write the chosen unit at the top of the sheet. The worksheet has a box for it for precisely this reason.
Step two: calculate the requirement
The requirement side is arithmetic, and the arithmetic is simple. The judgement is in one number.
Animals eat a proportion of their own body weight in dry matter each day. The published rules of thumb differ, and they differ for real reasons rather than because somebody is wrong:
- Guidance written for East African dairy cattle states that a dairy cow weighing 400 kilograms will consume an equivalent of about 3 per cent of its body weight in dry matter, which is 12 kilograms of dry matter per day.
- A veterinary reference states that goats can consume up to 6.5 per cent of their body weight as dry matter, and attributes this to a faster rate of passage through the digestive system, while noting that the same fast passage limits digestion of lower-quality forage.
- General livestock extension guidance puts cattle and sheep at between 2 and 3 per cent of live weight in dry matter daily, varying with feed quality: nearer 2 per cent on poor feed, 2.5 to 3 per cent on average feed.
Building a Twelve-Month Fodder Calendar for Your Own Farm
A calculation graphic showing the steps from animal live weight, through a percentage of body weight as dry matter, to a daily requirement, then multiplied by days in the month and by animal numbers to give a monthly herd requirement.
Three things follow from that spread, and they matter more than the numbers themselves.
Do not carry a figure across species. The goat figure and the cattle figure are not interchangeable and using one for the other will produce a calendar that is wrong by a factor you will not notice until the animals tell you.
Feed quality moves the figure. The same animal eats a smaller proportion of poor feed than of good feed, which is one of the cruelties of the dry season: the intake rate falls at the same time as the supply does.
Use a figure, write down which one you used, and stay with it. A calendar built on 3 per cent and reviewed against reality at the end of the year teaches you something. A calendar where the percentage drifts teaches you nothing.
Then the rest is mechanical. Daily requirement for one animal, times the number of days in the month, times the number of animals in that class. Do it for each class separately, because a lactating cow, a dry cow, a heifer and a calf are different animals for this purpose, then add the classes to get the monthly herd requirement.
Enter that figure in the top row of the worksheet for all twelve months.
Step three: plot the supply, source by source
Now the harder half, because supply is not one number and it is not steady.
Take each feed source on your farm separately and give it its own row. Grazing. Cut-and-carry fodder plots. Crop residues. Purchased feed. Anything conserved and held in store. Then, month by month, estimate what that source will actually deliver.
Estimating grazing. This is the hardest to quantify and the most important to try. The practical approach is to stop treating the paddock as a single thing and start recording. Note when it stops carrying the herd without supplementation, note when it recovers after rain, and note the interval. One year of that observation is worth more than any published figure, because it is your land.
Estimating cut fodder. This one you can measure directly, and you should. Cut a known area, weigh it, and record both. A hanging spring balance and an exercise book are the entire equipment list.
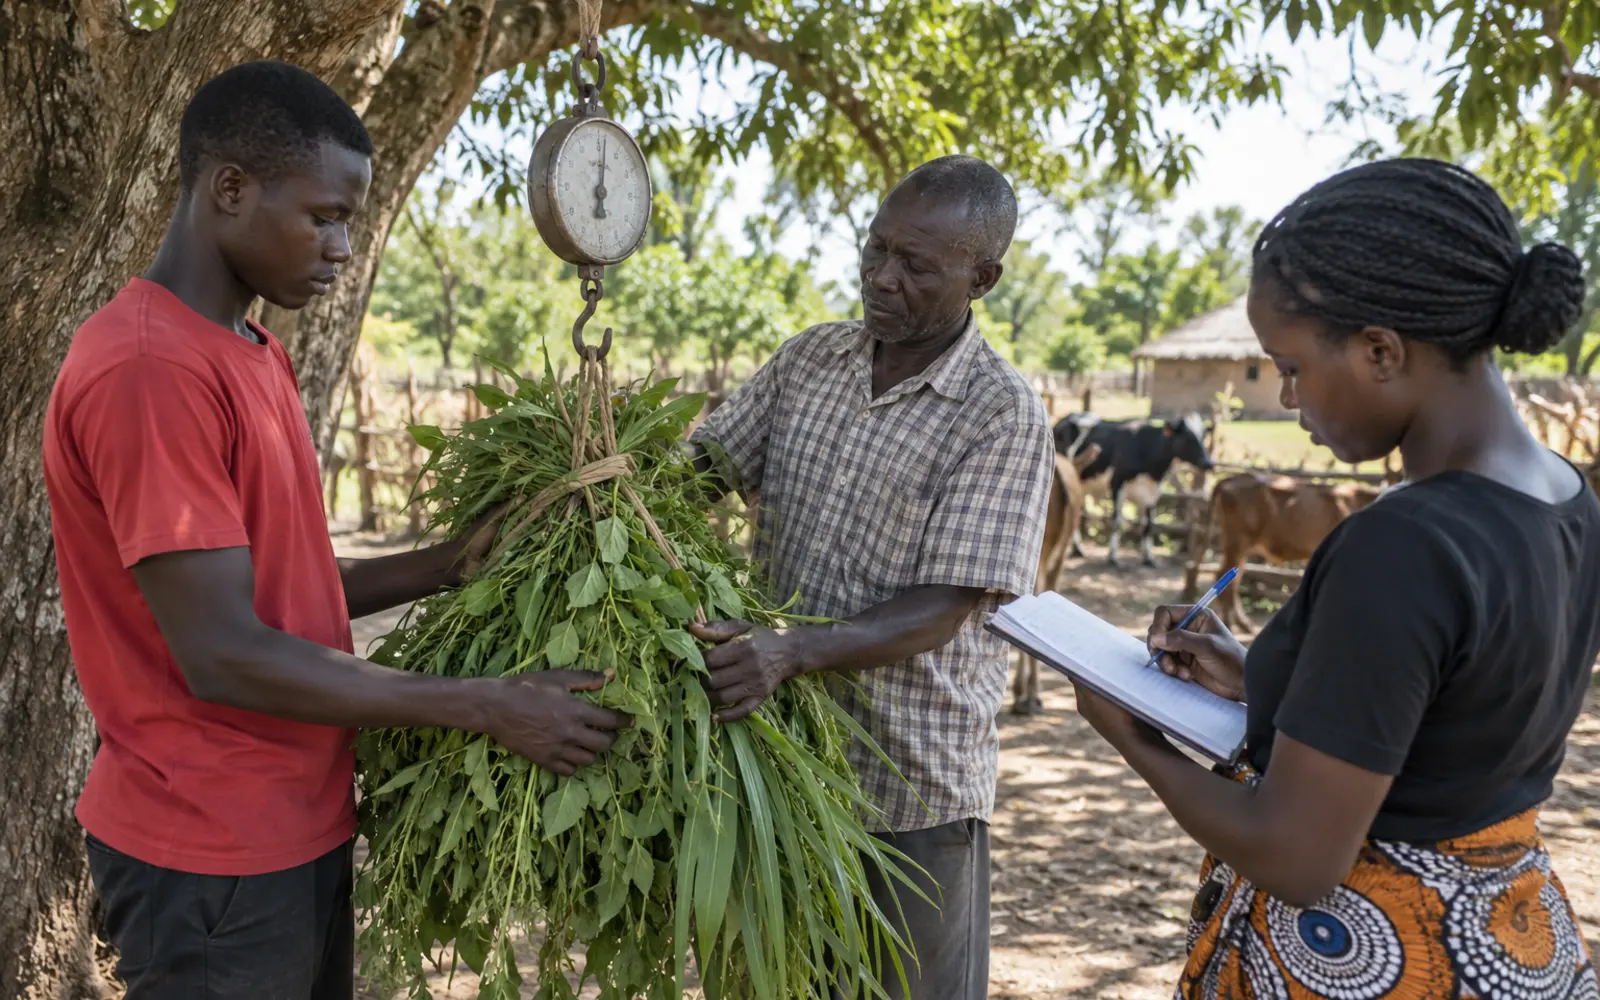
Remember that a fresh cut is mostly water. If your unit is dry matter, a fresh weight has to be converted, and the honest position is that without a drying oven you are estimating. State your assumption on the sheet rather than hiding it.
Estimating crop residues. These arrive in a pulse after harvest and then deteriorate. Plot them in the months they are actually available and usable, not in the months the crop was growing. Residues left in the field through a rainy season are not the same resource as residues brought in and stored.
Conserved feed. Enter it in the months you intend to feed it, not the month you made it. This is the whole point of conservation: it is supply moved deliberately from a surplus month to a deficit one.
Step four: find the deficit
Add the supply rows. Subtract from the requirement row. Write the result in the surplus or deficit row for every month.
This is the moment the sheet earns its existence. You now have, for each month, a number rather than a feeling.
Three patterns show up repeatedly, and each calls for a different response.
A short sharp deficit of one or two months. The most tractable case. There is usually enough surplus elsewhere in the year to cover it if that surplus is conserved rather than grazed off.
A long shallow deficit across four or five months. Harder, because conservation alone rarely covers it and the cumulative total is larger than it looks month by month. This pattern usually points to a stocking rate question rather than a conservation question.
A deficit that appears even in the wet months. This is not a seasonal problem. It is a farm that is carrying more animals than the land supports, and no amount of calendar work will fix it. That is a hard conclusion, and the calendar is the only way most keepers ever see it clearly.
A worked note on estimating a cut fodder plot
The supply row that most keepers find hardest is the planted fodder plot, and it is the one that can be measured most directly.
A Ugandan forage seed market study records Napier planting material requirements of 1,800 to 2,000 cuttings per acre and reports yields in the range of 3 to 5 tonnes per acre per cut. East African extension guidance for the same species reports that a well-managed plot can be harvested six to eight times in a year where rainfall is adequate.
Do not simply multiply those together and write the answer in your calendar. Two reasons. Those are fresh weights, and your calendar is in dry matter, so a conversion is needed and without a drying oven it is an estimate. And the harvest frequency is conditional on rainfall, which is precisely the variable that creates your deficit months in the first place: the plot that yields eight cuts in a good year will not yield eight in the year you most need it to.
The right use of those published figures is as a sanity check on your own measurements, not as a substitute for them. If your measured cut comes out wildly above or below that range, something is wrong with either the measurement or the plot, and finding out which is worth a morning.
Step five: check your months against your own rainfall, not the national pattern
Uganda’s national rainfall pattern is bimodal. The national meteorological guidance describes two major rainfall seasons, March to May and September to November or December, and states that the period from December to February is typically dry across Uganda, with February being the hottest month.
But the same source adds a qualification that matters enormously for a feed calendar: northern and parts of eastern Uganda usually receive substantial rainfall during June, July and August.
Building a Twelve-Month Fodder Calendar for Your Own Farm
A twelve-month horizontal strip marking Uganda's two main rainy seasons, the typically dry period, and the note that northern and parts of eastern Uganda receive substantial rain in the middle of the year.
So a calendar built on the national pattern will be wrong for a large part of the country. If you are in the north or parts of the east, the mid-year months that are a deficit in the south-west may be a surplus for you.
Use the national pattern as a starting frame, then correct it against what you have actually recorded on your own farm. The method for building that record is in rainfall records and seasonal forecasts in farm planning, and its value compounds: the third year of records is worth far more than the first.
Step six: decide, and write the decision on the sheet
A deficit month with no action written against it is a deficit month you will meet unprepared.
Building a Twelve-Month Fodder Calendar for Your Own Farm
A decision tree for responding to an identified deficit month, branching on how large the gap is, how many months ahead it falls, and whether land, labour or cash is the binding constraint.
The responses fall into five categories, and choosing between them is a matter of what your binding constraint actually is.
Conserve surplus from another month. The first option to consider whenever a surplus month exists. Conserving is covered separately in drum, bag and tube silage for small herds.
Plant additional fodder. Works only if the deficit is far enough ahead for establishment, which means this decision has to be made months early. Establishment is covered in planted fodder grasses.
Reduce the number of animals carried. The response keepers resist most and the one the arithmetic most often points to. A planned sale in a surplus month, at a price you chose, is a completely different transaction from a distress sale in the deficit month at the price everyone else is also accepting. How that price gets set is explained in how Ugandan farm-gate prices are formed.
Buy feed in, and budget for it. Legitimate, provided it is budgeted in advance rather than discovered as an emergency.
Accept reduced production, deliberately. Sometimes the right answer, particularly for a short deficit, is to plan for lower output in those weeks rather than spend heavily to prevent it. That is a decision, not a failure, and it is only available to a keeper who saw it coming.
Reviewing the calendar against what actually happened
The first calendar you build is a hypothesis, and treating it as anything more is the commonest way the exercise fails.
At the end of each month, write beside your predicted figures what actually occurred. Did grazing carry the herd as long as you expected. Did the plot yield what you assumed. Did the rains arrive in the month the national pattern says they should. Did you feed the conserved material in the month you planned to, or earlier.
Two things come out of that discipline. The obvious one is that next year’s calendar is built on your own measurements rather than on published averages, and is therefore substantially more accurate. The less obvious one is that you begin to see which of your assumptions were wrong in a consistent direction. A keeper who discovers that they systematically overestimate grazing by three weeks has learned something worth more than any single figure in this guide, because it corrects every future calendar they build.
Common mistakes
Mixing units. Bags, bundles, paddocks and kilograms do not add up.
Building the calendar once and never revising it. The first version is a hypothesis.
Using one intake percentage for every animal on the farm. Classes differ, species differ more.
Plotting crop residues in the growing months rather than the months they are usable.
Plotting conserved feed in the month it was made.
Ignoring that intake falls as feed quality falls, so the dry season squeezes from both directions.
Using the national rainfall pattern for a region it does not describe.
Leaving deficit months with no action written against them.
Treating destocking as defeat rather than as one of five legitimate responses.
Estimating grazing rather than recording it, year after year, and never accumulating the observation that would make the estimate good.
When to get outside help
Talk to a district production or veterinary officer, an extension officer or a livestock specialist when:
- The calendar shows a deficit in every month, including the wet ones. That is a stocking-rate conclusion and it is worth a second opinion before acting on it.
- Animals are losing condition in months the calendar says should be adequate. Either the calendar is wrong or something other than quantity is limiting, and both need diagnosis.
- You are considering a major change in herd size or composition on the strength of the sheet.
- You intend to buy in a feed you have not used before, particularly a by-product, where handling and inclusion limits matter.
- Animals show signs of ill health. A feed calendar is a planning tool and diagnoses nothing.
A practical action plan
This week: print the worksheet and write the unit at the top.
This week: list your animal classes and count them. Not a total. Classes.
This week: calculate the monthly requirement for each class and fill the top row for all twelve months. It is one calculation repeated, and it takes an evening.
This month: give every feed source its own row and fill in what you believe it delivers, month by month. Mark the cells you are least confident about; those are your measurement priorities.
This month: buy or borrow a hanging scale. Weigh one day’s cut from a known area and write it down. That single measurement will improve the whole sheet.
This month: subtract, and find your deficit months.
This month: write one action against each deficit month, with the month in which that action has to start. That second date is the one that matters.
Every month from now: record what actually happened beside what you predicted. Rainfall, when grazing failed, when it recovered, what you actually fed.
In twelve months: rebuild the calendar from your own records rather than from the estimates you started with. That version is the one worth keeping.
Conclusion
A fodder calendar is not a document that produces feed. It is a device for moving a decision from the month when it is impossible to the month when it is cheap.
The Ugandan evidence is blunt about what the dry season costs: milk yield falling, occasionally to nothing, and animals lost in the worst years. The same evidence shows that feed put in front of animals in those months recovers part of the loss. What stands between those two facts, for most farms, is not knowledge of the problem but the absence of a number early enough to act on.
Twelve columns, a few rows, one consistent unit, and a hanging scale. That is the whole method, and unlike almost everything else in livestock production, it costs nothing but an evening.
Author: Falcon Foundation Ltd Editorial Team
The Falcon Foundation Ltd Editorial Team produces evidence-based agricultural guidance for Ugandan farmers, drawing on published research and institutional sources and translating them into practical decision support. Where evidence is unavailable or contested, we say so rather than filling the gap.